ology. I am now using ProArgi9 Plus that includes several anti-aging components and will likely never switch. http://www.synergyworldwide.com/synergycorp/home.aspx

3) Are you employing any other unique practices in your patients to reduce cardiovascular events?

Withdrawing as many prescription drugs as possible.


Interesting. Of course, I also advocate l-arginine as a facilitator of atherosclerotic plaque regression, though I am not as ebullient about its use as Dr. Prendergast.

Instead, I see l-arginine as a method that yields forced normalization of “endothelial dysfunction,” the abnormal constriction and other effects that develop when abnormal lipoproteins and unhealthy food by-products are present in the circulation. Endothelial dysfunction is an inevitable accompaniment of plaque.

However, unlike Dr. Predergast’s experience, despite our use of doses higher than he uses, I have never seen plaque regression just using l-arginine alone. Nonetheless, it’s good to hear that others are seeing at least some positive effects.

By the way, we have also had some positive posts on our Forum about the ProArgi9 product he uses.

Dr. Dwight Lundell on omega-3s and CLA


An interview with Dr. Dwight Lundell, cardiac surgeon and author of the new book, "The Cure for Heart Disease."


Dr. Lundell comes to us with a unique pedigree. He is a cardiothoracic surgeon practicing in the Phoenix, Arizona, area. Despite having performed thousands of coronary bypass operations, including numerous "off-pump" procedures earning him a place in the Beating Heart Hall of Fame and a listing in Phoenix Magazine’s Top Doctors for 10 years, more recently Dr. Lundell has turned his attentions away from traditional surgical treatment and towards prevention of heart disease and.

In particular, Dr. Lundell is a vocal advocate for omega-3 fatty acids from fish oil and conjugated linoleic acid, or CLA.

When I heard about Dr. Lundell’s unique perspectives, I asked him if he’d like to tell us a little more about his ideas. Here follows a brief interview with Dr. Lundell.


You’re a vocal advocate of the role of omega-3 fatty acids from fish oil in heart disease prevention. Can you tell us how you use it?

In my book, I recommend 3 g of fish oil daily. This would normally yield about 1000 mg of EPA and DHA depending on the concentration of the supplement. This is approximately the dose that reduced sudden cardiac death by 50%, and all cause death, by 25% in patients with previous heart attack.

In patients with signs of chronic inflammation such as heart disease, obesity, arthritis, metabolic syndrome or depression or in those patients with elevation of CRP, I would recommend higher doses, 2000 to 3000 mg per day of EPA and DHA. The FDA has approved up to 3400 mg for treating patients with severely elevated triglycerides.

I personally take a 2000 mg EPA and DHA per day because I have calcium in my coronary arteries.


Of course, in the Track Your Plaque program we track coronary calcium scores. Do you track any measures of atherosclerosis in your patients to chart progression or regression?

Carotid ultrasound with measurement of IMT [intimal-medial thickness] has been shown to be a good surrogate marker for coronary disease, as has vascular reactivity in the arm. CT scanning with calcium scoring is a direct marker of coronary disease. CT does not differentiate between stable or unstable plaque but there is no good noninvasive way of doing this.

The dramatic value of CT scan calcium scoring is to demonstrate to people that they actually do have coronary disease and to motivate them to make the necessary lifestyle and nutritional changes to reduce it. CT scan with calcium scoring is a direct way to measure the progression or regression of coronary artery disease. If there is a choice between a direct measurement and indirect measurement, always choose the direct method.

Every patient treated with CLA in my clinic, experienced significant reductions in C-reactive protein. These patients were also on a weight-loss program, so I can't prove whether it was the CLA or the weight-loss that improved their inflammatory markers. In the animal model for arteriosclerosis, CLA has a dramatic effect of reducing and preventing plaque. This has not yet been proven in humans.

Normally, when people lose weight 20% or more of the loss is lean body mass (muscle) this lowers the metabolic rate and frustrates further weight-loss. My patient, from teenagers to retirees, lost no lean body mass and continued to have satisfactory weight-loss when CLA was used as part of the plan.


In reading your book, your use of conjugated linoleic acid (CLA) as a principal ingredient struck me. Can you elaborate on why you choose to have your patients take CLA?

My enthusiasm for CLA is based on:

1) Safety?this is of paramount importance. Animal toxicity studies have been done, as well as multiple parameters measured in human studies, both of these are well reviewed recently in the American Journal of Clinical Nutrition (2004:79(suppl)1132s). CLA, a naturally-occurring substance, is not toxic or harmful to animals or humans. The only negative report is by Riserus in Circulation (2002), where he found an elevated c- reactive protein; however, he used a preparation that is not commercially available and not found in nature as a single isomer.

2) Effectiveness?also critically important. A recent meta-analysis [a reanalysis of compiled data] in the American Journal of Clinical Nutrition (2007; 85:1203-1211) demonstrated the effectiveness of CLA in causing loss of body fat in humans. The study also reconfirmed the safety of CLA.

Since we now know that atherosclerosis is an inflammatory disorder, any strategy that reduces low-grade inflammation without significant side effects would seem to be beneficial in the treatment and prevention of atherosclerosis. CLA not only has antioxidant properties, but it modulates inflammatory cascade at multiple points. CLA reduces PGE2 (in much the same way as omega-3) CLA also has been shown to reduce IL-2, tumor necrosis factor-alpha and Cox–2. It reduces platelet deposition and macrophage accumulation in plaques. It also has some beneficial effect in the PPAR [peroxisome proliferator-activated receptors, important for lipid and inflammatory-mediator metabolism] area.

Part of the effect of CLA may be because it reduces fat mass and thus the amount of pro-inflammatory cytokines produced by fat cells.

I reiterate and fully admit that CLA has not been shown to have any effect on atherosclerosis in human beings. However, the results in the standard animal models for atherosclerosis (rabbits, hamsters,APO-E knockout mice) are very dramatic.

From all I know, it appears that the effective dose for weight loss and the animal studies in atherosclerosis would be equal to about 3 g of CLA per day. The anti-inflammatory properties of CLA seem to work better in the presence of adequate blood levels of omega-3.


I’m curious how and why a busy cardiothoracic surgeon would transform his practice so dramatically. Was there a specific event that triggered your change?

The transition from a very busy surgical practice to writing and speaking about the prevention of coronary disease has not been particularly easy, but it has been very interesting. I can't really point to any specific epiphany, it was a general feeling of frustration that we were not making any progress in curing heart disease, which is what I thought I was doing when I began my medical career.

Of course, I enjoyed the technical advances, the dramatic life-saving things that you do and I did on a daily basis. American medicine is spectacularly good at managing crises and spectacularly horrible at preventing those crises.

The lipid hypothesis is old and tired, even the most aggressive statin therapy reduces risk of heart attack by about 30% in a relatively small subset of people. It's interesting that we're now looking at statins as an anti-inflammatory agent.


Thanks, Dr. Lundell. We look forward to future conversations as your experience with CLA and heart disease prevention and reversal develops!


More about Dr. Lundell's book, The Cure for Heart Disease can be found at http://www.thecureforheartdisease.net.


Note: We are planning a full Special Report on CLA for the Track Your Plaque website in future.

High-tech heart attack proofing


I was reminiscing the other day about what I was taught about heart disease in medical school some 20 years ago.

In the 1980s, the world was still (and remains) fascinated with this (then) novel "solution" to heart disease called coronary bypass surgery. As medical students, we all fought for a chance to watch a bypass operation being performed. And there was lots of opportunity. I was a medical student at St. Louis University School of Medicine, a center that boasted of a busy thoracic surgery service, performing up to 10 bypass operations every day.

Back then, coronary angioplasty was just a twinkle in Andreas Gruentzig's eye, still contemplating whether it was possible to put an inflatable device in the blockages of coronary arteries to re-establish blood flow. Risk detection for heart disease consisted of EKGs, screening for symptoms, detection of heart failure, and tests that are long forgotten in the dust bin of medical curiosities, tests like systolic-time intervals, phonocardiography (using amplified sound to detect abnormal heart sounds), and detailed physical examination. Treatment for heart attack involved nitroglycerin and extended bedrest. Bypass surgery would come after you recovered.

In other words, NONE of the tools we now use in the Track Your Plaque program for heart disease control and reversal were available just twenty years ago. There was no lipoprotein testing, no CT heart scans. Nobody recognized the power of omega-3 fatty acids (although epidemiologic observations were just beginning to suggest that eating fish might be the source of reduced risk for heart attack and cardiovascular death). Vitamin D? Why, that's in your milk so your babies don't get rickets.

So much of what we do today was not available then, nor were they even in the crystal ball of forward-looking people. I certainly had no idea whatsoever that I'd be talking and obsessing today about reversal of heart disease based on what I saw and learned back then.

Things have certainly come a long way and all for the better. The problem is that much of the world is stuck in 1985 and haven't yet heard that coronary disease is a manageable and reversible process. They've been sidetracked by the fiction propagated by the likes of Dr. Dean Ornish, the nonsense of low-fat diets aided and abetted by the food manufacturing industry and the USDA, the extravagant claims of some practitioners and the supplement industry. They haven't yet stumbled on the real-life experiences that are chronicled here in this Blog and the accompanying Track Your Plaque website.

Our program has been criticized for being too "high-tech," involving too many sophisticated measures like small LDL, lipoprotein(a) treatment, vitamin D blood levels. But when you see a woman reduce her heart scan score 63%, or a school principal's score plummet 51%, then that's reward in itself.

It's all about plaque

Just to keep my finger on the pulse of what is being said in the world of heart disease by the media, I subscribe to many publications.

Conversations abound about cholesterol, low-fat diets, now low-carb diets, not smoking, inflammation, etc. No doubt, these all have some importance in the conversation.

But the great majority of discussions fail to identify the one truly crucial factor to identify and track: coronary atherosclerotic plaque.

Sugar for breakfast

We were reviewing Stuart's diet because of his persistent small LDL, low HDL, modestly elevated triglycerides, and blood sugar of 107 mg/dl.

"I've changed my diet, doc. No kidding. We never fry our foods. No butter, no goodies. I don't know what else I can possibly do."

"Okay. Let's review your diet. What did you have for breakfast?"

"Orange juice, a big glass. Gotta get my potassium. Then cereal like Cheerios or Shredded Wheat, sometimes Kashi or Raisin Bran, always in skim milk. Gotta have my one slice of toast, no butter. I'll put some fruit preserves on it. You know, real fruit. Only whole wheat bread, never white. On Sundays, we always go out for pancakes, but now we order only whole wheat."

Many of us have gotten into a peculiar habit: Having what amounts to pure sugar for breakfast. Perhaps there's a little fiber thrown in with it, but many people indulge in breakfasts that are sugar and plenty of it. That's precisely what Stuart is doing: A breakfast that, while it doesn't contain a huge amount of sugar outside of the orange juice, is promptly converted to sugar. If we were to check his blood sugar just after his standard breakfast, it would rise substantially.

This pattern has become deeply ingrained into the American psyche. Some people will act like I've suggested we overthrow the government when I suggest that breakfast cereals need to be eliminated from their lives. We all share memories of Tony the Tiger, the leprechaun on Lucky Charms ("They're magically delicious!), reading the brightly colored boxes often including games and prizes. Breakfast cereals seem as American as apple pie. But the wheat and corn content ensures a big rise in blood sugar, the sort that create small LDL, low HDL, etc.--all the patterns Stuart is showing--and make us fat.

Orange juice? Too much sugar all at once. Get your potassium from whole vegetables and fruits, not from orange juice. (Bananas are another problem source of potassium for similar reasons despite being a whole fruit.)

Toast? Any diabetic who monitors their blood sugar after meals will tell you: Even one slice of bread, ANY bread, skyrockets blood sugar. Add the fruit preserves made with sugar syrup and it's doubly worse.

Pancakes? Even if made with plenty of fiber, blood sugars go absolutely berserk after a meal like this, especially if maple syrup is added.

In other words, the seemingly healthy breakfast Stuart eats guarantees that he fails to control all his patterns that contribute to his coronary plaque growth.

After I pointed out Stuart's dietary faux pas, he asked, "Then what the heck can I eat?"

"There's actually lots of good choices: Eggs (preferably free-range, if available, or the 'omega-3' enriched) or Egg Beaters; oat products, but true oat products like slow-cooked oatmeal, or the best of all, oat bran, used as a hot cereal; ground flaxseed as a hot cereal with added fruit, berries, nuts; a handful of raw almonds, walnuts, pecans; some cheese, preferably traditional fermented cheese and not processed; low-fat cottage cheese; low-fat yogurt that you flavor yourself with berries and nuts; raw seeds like sunflower and pumpkin.

"Try and save some of your dinner foods for breakfast. For instance, save some green peppers and onions from your salad and put it in your scrambled eggs along with some olive oil. Save some of the chicken and add it to your breakfast. Save some of the cooked vegetables and have them as they are. You'll be surprised how filling dinner foods can be when eaten for breakfast."

It's not that tough. But Stuart and many other people need to break the hold that the food manufacturers have created. If you're hoping to seize hold of your heart scan score, get rid of the sugar foods in your morning, even the ones cleverly disguised as healthy.

The Low-Carb Man

If ever there was an enthusiastic disciple of deceased Dr. Robert Atkins of Atkins' Diet fame, it's Mr. Jimmy Moore.


Jimmy tells the story of how he was transformed by the Atkins' approach, losing 180 lbs in the course of one year. He continues to develop this conversation, in many ways elaborating on the conversation in more sophisticated ways than even Atkins did in his lifetime.

Though we've agreed to disagree on some points of nutrition, Jimmy and I had a recent discussion about heart disease, the mis-guided ways of conventional cardiac care,and the evils of processed carbohydrates. We do differ on the role of saturated fat in heart disease and health, but beyond that difference I was impressed (reading his Blog and listening to his many webcasts) with his level of understanding of the issues. Jimmy is not some over-enthusiastic dieter. He has a grasp of the issues that exceeds that of 99% of my colleagues.

If you are interested in reading our discussion or just perusing a really fun, informative Blog/website, go to LivinLaVidaLowCarb.com. The interview is posted at:

http://livinlavidalocarb.blogspot.com/2007/08/davis-wanna-cut-plaque-in-your-arteries.html


See Jimmy Moore's before and after pictures at http://livinlavidalocarb.blogspot.com/2005/07/my-before-pictures.html. He's quite an entertaining read.

Why average cholesterol values can be so bad

Jack had been told again and again that there was absolutely nothing wrong with his cholesterol panel. His numbers:

Total cholesterol 198 mg/dl

LDL cholesterol 119 mg/dl--actually below the national average (131 mg/dl).

HDL 48 mg/dl--actually above the average HDL for a male (42 mg/dl).

Triglycerides 153 ng/dl--right at the average.


So his primary care physician was totally stumped when Jack's heart scan revealed a score of 410.


Lipoprotein analysis (NMR) told an entirely different story:

LDL particle number 1880 nmol/l (take off the last digit to generate an approximate real LDL, i.e., 188 mg/dl).

Small LDL 95% of all LDL particles, a very severe pattern.

A severe excess of intermediate-density lipoprotein (218 nmol/l), suggesting that dietary fats are not cleared for 24 hours or so after a meal.

And those were just the major points. In other words, where conventional cholesterol values, or lipids, failed miserably, lipoprotein analysis can shine. The causes for Jack's high heart scan score become immediately apparent, even obvious. Jack's abnormalities are relatively easy to correct--but you have to know if they're present before they can be corrected. A shotgun statin drug approach could only hope to correct a portion of this pattern, but would unquestionably fail to fully correct the pattern.

As I've said before, standard cholesterol testing is a fool's game. You can squeeze a little bit of information out of them, but there's so much more information that can be easily obtained through lipoprotein testing like Jack had.

Cholesterol trumps heart scan?

Lela's heart scan score: 449--very high for a 49-year old, peri-menopausal woman. Her score placed her flat in the 99th percentile, or the worst 1% of women her age.

Lela first consulted her primary care physician. Her doctor looked at the result puzzled. "Now wait a minute. Your cholesterol numbers have been great." After a pause, her doctor (a woman) declared the heart scan wrong. "Tests aren't perfect. The heart scan is simply wrong. I'm going to believe the cholesterol numbers and there's no way you have heart disease."

Is that right? Can cholesterol numbers trump your heart scan score? Can the heart scan simply be wrong?

The answer is simple: NO.

The heart scan is not wrong. The heart scan is right. What is wrong with this picture is that standard cholesterol testing commonly and frequently fails to identify people at risk for heart disease.

What if this woman smoked? That wouldn't be revealed in her cholesterol panel. Or had high blood pressure, increased inflammatory responses like C-reactive protein, had increased small LDL or lipoprotein(a), was severely deficient in vitamin D? None of that would be revealed by cholesterol numbers.

So, no, the heart scan is not wrong. The cholesterol numbers are not wrong. The doctor's interpretation of the data is wrong.

Please do not allow false reassurances offered by those who do not understand the technology steer you wrong.

This woman proved to have an entire panel of hidden causes of her coronary plaque uncovered. No surprise.

Boycott LabCorp

Track Your Plaque Members have been following this conversation on the Track Your Plaque Forum.

A good number of people have had their blood drawn for NMR lipoprotein analysis through laboratories operated by the Laboratory Corporation of American, or LabCorp. When the results were returned, the very important page 2 of the report was withheld. Many of us have communicated with the company, only to be given some corporate-speak about internal policy.

I have personally expressed my dissatisfaction, my outrage, at this silly policy. Why would laboratory results that you or your insurance paid for be denied to you? It is my understanding that, on request, you are legally entitled to the information. The page 2 information is provided by the laboratory (Liposcience, Inc.) that actually performs the testing. LabCorp does nothing more than draw the blood, prepare the specimen, then convey and dilute the results that Liposcience reports to them.

My personal suspicion is that the LabCorp people do this to 1) make the results appear that they actually performed the tests and not farmed to an outside laboratory (Liposcience), and 2) not further confuse and befuddle the bungling primary care physician who barely understands cholesterol issues to begin with. "LDL, HDL, triglycerides . . . What now--a bunch of new information, bars even!?

To me, this LabCorp policy is criminal. In fact, I wonder if this has the substance to justify a class action lawsuit against LabCorp. I believe that we can easily make a case that crucial health information is being systematically denied to people.

If this has affected you, or if you share in the frustration of many people who have had watered down lipoprotein results provided, write to:
But tomorrow never comes.  You get the drift.  We can all come up with a million yeah buts, in other words, excuses.    The good news is the treatment for YBS is simple--just do it!  Take action.  The reality of today’s 24-7 planet is there will always be something.  The kids, work commitments, family obligations and various projects that need your attention will perpetually be present in some shape or form.  The difference to make the difference is to learn to dance in the rain, not wait for the rain to pass.  When will all the stars align so that your world will be “just right” to start?  If not NOW, WHEN will you begin?  

The key word here is begin.   Far too frequently, I coach clients that shoot themselves in the foot before they start.   Instead of consuming yourself with all the barriers to entry, select reasonable, low-hanging fruit that is “doable.”    The art of lifestyle change is to avoid all-or-nothing thinking and begin to appreciate what you CAN do, versus focusing energy on what you can’t do.  What is one action you can do TODAY to move toward your wellness goal(s)?  Start to focus on what you can do in the mist of your existing life demands. This mantra is a friendly reminder: BE-DO-HAVE.  Be committed.  Do what it takes.  And you will have results.  

Lastly, if you think removing cereal from your morning routine it is too difficult and you can’t do it. Guess what-- you’re likely right.   What you think is what you get!   But what if you think instead, “I can do this.  There are many truly healthy options for breakfast to replace cereal such as eggs and veggies that will help me look and feel my best.”  Then guess what--you will!  This simple change in mind-set can start a tidal wave of change and prevent you from abandoning ship when life tosses you into rough waters.  Ongoing support is hugely important to sustain lifestyle changes.  Join the conversations in the Cureality Forum to engage the support of health coaches and Cureality Members to stay on track. 

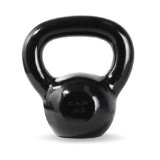
We Need More.....Kettlebell

You either love them or you hate them.

When you are in love with kettlebells, like I am, you enjoy the multi-muscle group movements.  Kettlebell workouts are fluid, like a dance, putting together a chain of movements that leave your heart pounding and sweat pouring.  Yes, there’s some sneaky cardio component to a kettlebell workout.   A great blend of aerobic and anaerobic conditioning.

If you hate kettlebells it’s because kettlebell exercises keep you honest with proper exercise execution.  Form is imperative to moves like the kettlebell swing or the kettlebell snatch.  Do it incorrectly and you’ll be either sore or have bruised wrists the next day.  But this is no reason to shy away from the kettlebell.  You have way too much to gain from this odd looking piece of exercise equipment.  

You will get a mega -caloric burn.  The American council on Exercise states that the average kettlebell workout burns 20 calories per minute.  That’s 1200 calories in just one hour.   Kettlebell workouts utilize many muscle groups to give you an efficient, total body conditioning workout.  

If you’re looking for a toned back side get a kettlebell.  The classic kettlebell swing works all the posterior muscles like your glutes, hamstrings, and lower back.  But only if you use correct form.  Otherwise you'll find yourself with nagging back pain, instead of a better butt.  

Kettlebell exercises are functional movements that will allow you to play hard without getting injured.  If you are an athlete, a nature enthusiast, or just want to keep up with the kids then you need to give kettlebells a try.  During a workout, the exercises will target movements that will make getting up and down off the floor easier, as well as bending over to pick something up.

If you are interested in doing kettlebell workouts start with a coach or take class.  You can’t fake form with kettlebell exercises or you could end up hurt.  I’m not trying to scare anyone away because good form is easy to learn.   Your body will memorize the correct movement pattern and you’ll be on your way to a successful kettlebell workout.  

Thyroid and the gut: Hidden health partners

Though I have personally dealt with both auto-immune thyroiditis (Hashomoto’s) and several gut issues (wheat sensitivity, gastritis, etc.), it was not until recently that I discovered how close the thyroid and gut work together to keep you healthy – and how problems with one can affect the other along with your overall health.
 
Most of us understand that the primary function of the gut, that 25 to 30 feet of “tubing” that includes everything from your stomach to your large intestines, is to process the food we eat and allow the “good stuff” (essential nutrients) to pass into our blood stream while keeping the “bad stuff” (harmful proteins) out. However, it may surprise some that the gut also holds as much as 70% of all the immune tissue in the body.
 
Now, imagine all the health havoc that could ensue if, suddenly, the gut stopped doing its job – particularly if it failed to stop toxic proteins from entering the blood stream and then mounted an overzealous immune response against them.  Sometimes, those overzealous immune responses reach beyond their intended targets to attack otherwise healthy tissues and organs – like the thyroid gland.
 
Recent studies indicate that thyroid hormones play a significant role in maintaining gut integrity, preventing leaky gut that can, in some cases, lead to auto-immune attacks against the thyroid.  A properly functioning gut also aids the production of thyroid hormones by converting some of the inactive “T4” thyroid hormone into the functional “T3” hormone.  Failure to simultaneously maintain both a healthy gut and a healthy thyroid can create a vicious cycle leading to chronic health problems and declining vitality.
 
What it all means is that to enjoy optimal health, you must promote good thyroid health to promote good gut health and vice versa.  Unfortunately, traditional medicine tends to focus on one issue to the exclusion of others.  A typical endocrinologist may treat your under active thyroid without spending a moment to address underlying gut issues.  A gastroenterologist will work alleviate a gut problem but will rarely address a potential thyroid problem.
 
This illustrates, once again, how our bodies work as a system and why it is necessary to bridge the “healthcare gaps” in traditional medicine by becoming personally responsible for your health.  I encourage everyone to consult the Cureality Program Guide and online Cureality Diet and Thyroid Health Tracks to learn more about how to optimize both your gut and thyroid health on your journey to realizing complete, whole-body health.

Omega-3 fatty acids likely NOT associated with prostate cancer

A weakly constructed study was reported recently that purportedly associated higher levels of omega-3 fatty acid blood levels and prostate cancer. See this CBS News report, for instance.

Lipid and omega-3 fat expert, Dr. William Harris, posted this concise critique of the study, exposing some fundamental problems:

First, the reported EPA+DHA level in the plasma phospholipids in this study was 3.62% in the no-cancer control group, 3.66% in the total cancer group, 3.67% in the low grade cancer group, and 3.74% in the high-grade group. These differences between cases and controls are very small and would have no meaning clinically as they are within the normal variation. Based on experiments in our lab, the lowest quartile would correspond to an HS-Omega-3 Index of <3.16% and the highest to an Index of >4.77%). These values are obviously low, and virtually none of the subjects was in “danger” of having an HS-Omega-3 Index of >8%. So to conclude that regular consumption of 2 oily fish meals a week or taking fish oil supplements (both of which would result in an Index above the observed range) would increase risk for prostate cancer is extrapolating beyond the data.

This study did not test the question of whether giving fish oil supplements (or eating more oily fish) increased PC risk; it looked only a blood levels of omega-3 which are determined by intake, other dietary factors, metabolism and genetics.


The authors also failed to present the fuller story taught by the literature. The same team reported in 2010 that the use of fish oil supplements was not associated with any increased risk for prostate cancer. A 2010 meta-analysis of fish consumption and prostate cancer reported a reduction in late stage or fatal cancer among cohort studies, but no overall relationship between prostate cancer and fish intake. Terry et al. in 2001 reported higher fish intake was associated with lower risk for prostate cancer incidence and death, and Leitzmann et al. in 2004 reported similar findings. Higher intakes of canned, preserved fish were reported to be associated with reduced risk for prostate cancer. Epstein et al found that a higher omega-3 fatty acid intake predicted better survival for men who already had prostate cancer, and increased fish intake was associated with a 63% reduction in risk for aggressive prostate cancer in a case-control study by Fradet et al). So there is considerable evidence actually FAVORING an increase in fish intake for prostate cancer risk reduction.

Another piece of the picture is to compare prostate cancer rates in Japan vs the US. Here is a quote from the World Foundation of Urology:


"[Prostate cancer] incidence is really high in North America and Northern Europe (e.g., 63 X 100,000 white men and 102 X 100,000 Afro-Americans in the United States), but very low in Asia (e.g., 10 X 100,000 men in Japan).”

Since the Japanese typically eat about 8x more omega-3 fatty acids than Americans do and their
blood levels are twice as high, you’d think their prostate cancer risk would be much higher...
but the opposite is the case.


Omega-3 fatty acids are physiologically necessary, normalizing multiple metabolic phenomena including augmentation of parasympathetic tone, reductions of postprandial (after-meal) lipoprotein excursions, and endothelial function. It would indeed make no sense that nutrients that are necessary for life and health exert an adverse effect such as prostate cancer at such low blood levels. (Recall that an omega-3 RBC index of 6.0% or greater is associated with reduced potential for sudden cardiac death.)

I personally take 3600 mg per day of EPA + DHA in highly-purified, non-oxidized triglyceride form (Ascenta Nutrasea liquid) that yields an RBC omega-3 index of just over 10%, the level that I believe the overwhelming bulk of data suggest is the ideal level for humans.

Are statins and omega-3s incompatible?

French researcher, Dr. Michel de Lorgeril, has been in the forefront of thinking and research into nutritional issues, including the Mediterranean Diet, the French Paradox, and the role of fat intake in cardiovascular health. In a recent review entitled Recent findings on the health effects of omega-3 fatty acids and statins, and their interactions: do statins inhibit omega-3?, he explores the question of whether statin drugs are, in effect, incompatible with omega-3 fatty acids.

Dr. Lorgeril makes several arguments:

1) Earlier studies, such as GISSI-Prevenzione, demonstrated reduction in cardiovascular events with omega-3 fatty acid supplementation, consistent with the biological and physiological benefits observed in animals, experimental preparations, and epidemiologic observations in free-living populations.

2) More recent studies (and meta-analyses) examining the effects of omega-3 fatty acids have failed to demonstrate cardiovascular benefit showing, at most, non-significant trends towards benefit.

He points out that the more recent studies were conducted post-GISSI and after agencies like the American Heart Association's advised people to consume more fish, which prompted broad increases in omega-3 intake. The populations studied therefore had increased intake of omega-3 fatty acids at the start of the studies, verified by higher levels of omega-3 RBC levels in participants.

In addition, he raises the provocative idea that the benefits of omega-3 fatty acids appear to be confined to those not taking statin agents, as suggested, for instance, in the Alpha Omega Trial. He speculates that the potential for statins to ablate the benefits of omega-3s (and vice versa) might be based on several phenomena:

--Statins increase arachidonic acid content of cell membranes, a potentially inflammatory omega-6 fatty acid that competes with omega-3 fatty acids. (Insulin provocation and greater linoleic acid/omega-6 oils do likewise.)
--Statins induce impaired mitochondrial function, while omega-3s improve mitochondrial function. (Impaired mitochondrial function is evidenced, for instance, by reduced coenzyme Q10 levels, with partial relief from muscle weakness and discomfort by supplementing coenzyme Q10.)
--Statins commonly provoke muscle weakness and discomfort which can, in turn, lead to reduced levels of physical activity and increased resistance to insulin. (Thus the recently reported increases in diabetes with statin drug use.)

Are the physiologic effects of omega-3 fatty acids, present and necessary for health, at odds with the non-physiologic effects of statin drugs?

I fear we don't have sufficient data to come to firm conclusions yet, but my perception is that the case against statins is building. Yes, they have benefits in specific subsets of people (none in others), but the notion that everybody needs a statin drug is, I believe, not only dead wrong, but may have effects that are distinctly negative. And I believe that the arguments in favor of omega-3 fatty acid supplementation, EPA and DHA (and perhaps DPA), make better sense.


DHA: the crucial omega-3

Of the two omega-3 fatty acids that are best explored, EPA and DHA, it is likely DHA that exerts the most blood pressure- and heart rate-reducing effects. Here are the data of Mori et al in which 4000 mg of olive oil, purified EPA only, or purified DHA only were administered over 6 weeks:


□ indicates baseline SBP; ▪, postintervention SBP; ○, baseline DBP; •, postintervention DBP; ⋄, baseline HR; and ♦, postintervention HR.

In this group of 56 overweight men with normal starting blood pressures, only DHA reduced systolic BP by 5.8 mmHg, diastolic by 3.3 mmHg.

While each omega-3 fatty acid has important effects, it may be DHA that has an outsized benefit. So how can you get more DHA? Well, this observation from Schuchardt et al is important:

DHA in the triglyceride and phospholipid forms are 3-fold better absorbed, as compared to the ethyl ester form (compared by area-under-the-curve). In other words, fish oil that has been reconstituted to the naturally-occurring triglyceride form (i.e., the form found in fresh fish) provides 3-fold greater blood levels of DHA than the more common ethyl ester form found in most capsules. (The phospholipid form of DHA found in krill is also well-absorbed, but occurs in such small quantities that it is not a practical means of obtaining omega-3 fatty acids, putting aside the astaxanthin issue.)

So if the superior health effects of DHA are desired in a form that is absorbed, the ideal way to do this is either to eat fish or to supplement fish oil in the triglyceride, not ethyl ester, form. The most common and popular forms of fish oil sold are ethyl esters, including Sam's Club Triple-Strength, Costco, Nature Made, Nature's Bounty, as well as prescription Lovaza. (That's right: prescription fish oil, from this and several other perspectives, is an inferior product.)

What sources of triglyceride fish oil with greater DHA content/absorption are available to us? My favorites are, in this order:

Ascenta NutraSea
CEO and founder, Marc St. Onge, is a friend. Having visited his production facility in Nova Scotia, I was impressed with the meticulous methods of preparation. At every step of the way, every effort was made to limit any potential oxidation, including packaging in a vacuum environment. The Ascenta line of triglyceride fish oils are also richer in DHA content. Their NutraSea High DHA liquid, for instance, contains 500 mg EPA and 1000 mg DHA per teaspoon, a 1:2 EPA:DHA ratio, rather than the more typical 3:2 EPA:DHA ratio of ethyl ester forms.

Pharmax (now Seroyal) also has a fine product with a 1.4:1 EPA:DHA ratio.

Nordic Naturals has a fine liquid triglyceride product, though it is 2:1 EPA:DHA.


Krill oil: Do the math

The manufacturers of krill oil claim that the phospholipid form of omega-3 fatty acids, EPA and DHA, enhance their absorption. There are indeed some data to that effect:


Here are some representative krill oil preparations available on the market:


MegaRed Krill Oil:
EPA 50 mg
DHA 24 mg
Total omega-3s (EPA + DHA + other forms) 90 mg
Price: $28.99 for 60 softgels

Source Naturals (a fine company otherwise, by the way):

EPA 150 mg
DHA 90 mg
Total omega-3 fatty acids 300 mg
Price: $24.99 for 60 softgels

Alright, let's do some simple math:

Average volume of blood in the human body (all components): 5000 cc
Percentage of red blood cells (RBCs) by volume: 45%
Total volume RBCs: 2250 cc
Percentage of total volume RBCs occupied by fatty acids:

What tests are MORE important than cholesterol?

In the conventional practice of early heart disease prevention, cholesterol testing takes center stage. Rarely does it go any further, aside from questions about family history and obvious sources of modifiable risk such as smoking and sedentary lifestyle.

So standard practice is to usually look at your LDL cholesterol, the value that is calculated, not measured, then--almost without fail--prescribe a statin drug. While there are indeed useful values in the standard cholesterol panel--HDL cholesterol and triglycerides--they are typically ignored or prompt no specific action.

But a genuine effort at heart disease prevention should go farther than an assessment of calculated LDL cholesterol, as there are many ways that humans develop coronary atherosclerosis. Among the tests to consider in order to craft a truly effect heart disease prevention program are:

--Lipoprotein testing--Rather than using the amount of cholesterol in the various fractions of blood as a crude surrogate for lipoproteins in the bloodstream, why not measure lipoproteins themselves? These techniques have been around for over 20 years, but are simply not part of standard practice.

Lipoprotein testing especially allows you to understand what proportion of LDL particles are the truly unhealthy small LDL particles (that are oxidation- and glycation-prone). It also identifies whether or not you have lipoprotein(a), the heritable factor that confers superior survival capacity in a wild environment ("The Perfect Carnivore"), but makes the holder of this genetic pattern the least tolerant to the modern diet dominated by grains and sugars, devoid of fat and organ meats.

--25-hydroxy vitamin D--The data documenting the health power of vitamin D restoration continue to grow, with benefits on blood sugar and insulin, blood pressure, bone density, protection from winter "blues" (seasonal affective disorder), decrease in falls and fractures, decrease in cancer, decrease in cardiovascular events. I aim to keep 25-hydroxy vitamin D at a level of 60 to 70 ng/ml. This generally requires 4000-8000 units per day in gelcap form, at least for the first 3 or so years, after which there is a decrease in need. Daily supplementation is better than weekly, monthly, or other less-frequent regimens. The D3 (cholecalciferol) form is superior to the non-human D2 (ergocalciferol) form.

--Hemoglobin A1c (HbA1c)--HbA1c represents glycated hemoglobin, i.e., hemoglobin molecules within red blood cells that are irreversibly modified by glucose, or blood sugar. It therefore provides an index of endogenous glycation of all proteins of the body: proteins in the lenses of the eyes that lead to cataracts; proteins in the cartilage of the knees and hips that lead to brittle cartilage and arthritis; proteins in kidney tissue leading to kidney dysfunction.

HbA1c provides an incredibly clear snapshot of health: It reflects the amount of glycation you have been exposed to over the past 90 or so days. We therefore aim for an ideal level: 5.0% or less, the amount of "ambient" glycation that occurs just with living life. We reject the notion that a HbA1c level of 6.0% is acceptable just because you don't "need" diabetes medication, the thinking that drives conventional medical practice.

--RBC Omega-3 Index--The average American consumes very little omega-3 fatty acids, EPA and DHA, such that a typical omega-3 RBC Index, i.e., the proportion of fatty acids in the red blood cell occupied by omega-3 fatty acids, is around 2-3%, a level associated with increased potential for sudden cardiac death (death!). Levels of 6% or greater are associated with reduced potential for sudden cardiac death; 10% or greater are associated with reduced other cardiovascular events.

Evidence therefore suggests that an RBC Omega-3 Index of 10% or greater is desirable, a level generally achieved by obtaining 3000-3600 mg EPA + DHA per day (more or less, depending on the form consumed, an issue for future discussion).

--Thyroid testing (TSH, free T3, free T4)--Even subtle degrees of thyroid dysfunction can double, triple, even quadruple cardiovascular risk. TSH values, for instance, within the previously presumed "normal" range, pose increased risk for cardiovascular death; a TSH level of 4.0 mIU, for instance, is associated with more than double the relative risk of a level of 1.0.

Sad fact: the endocrinology community, not keeping abreast of the concerning issues coming from the toxicological community regarding perchlorates, polyfluorooctanoic acid and other fluorinated hydrocarbons, polybrominated diphenyl ethers (PDBEs), and other thyroid-toxic compounds, tend to ignore these issues, while the public is increasingly exposed to the increased cardiovascular risk of even modest degrees of thyroid dysfunction. Don't commit the same crime of ignorance: Thyroid dysfunction in this age of endocrine disruption can be crucial to cardiovascular and overall health.


All in all, there are a number of common blood tests that are relevant--no, crucial--for achieving heart health. Last on the list: standard cholesterol testing.

Cranberry Sauce

Happy Thanksgiving 2012, everyone, from all the staff at Track Your Plaque!

Here’s a zesty version of traditional cranberry sauce, minus the sugar. The orange, cinnamon, and other spices, along with the crunch of walnuts, make this one of my favorite holiday side dishes.

There are 31.5 grams total “net” carbohydrates in this entire recipe, or 5.25 grams per serving (serves 6). To further reduce carbs, you can leave out the orange juice and, optionally, use more zest.

1 cup water
12 ounces fresh whole cranberries
Sweetener equivalent to 1 cup sugar (I used 6 tablespoons Truvía)
1 tablespoon orange zest + juice of half an orange
½ cup chopped walnuts
1 teaspoon ground cinnamon
½ teaspoon ground nutmeg
¼ teaspoon ground cloves

In small to medium saucepan, bring water to boil. Turn heat down and add cranberries. Cover and cook at low-heat for 10 minutes or until all cranberries have popped. Stir in sweetener. Remove from heat.

Stir in orange zest and juice, walnuts, cinnamon, nutmeg, and cloves.

Transfer mixture to bowl, cool, and serve.


Apple Cranberry Crumble

Apple, cranberry, and cinnamon: the perfect combination of tastes and scents for winter holidays!

I took a bit of carbohydrate liberties with this recipe. The entire recipe yields a delicious cheesecake-like crumble with 59 “net” grams carbohydrates (total carbs – fiber); divided among 10 slices, that’s 5.9 grams net carbs per serving, a quantity most tolerate just fine. (To reduce carbohydrates, the molasses in the crumble is optional, reducing total carbohydrate by 11 grams.)

Other good choices for sweeteners include liquid stevia, stevia glycerite, powdered stevia (pure or inulin-based, not maltodextrin-based), Truvía, Swerve, and erythritol. And always taste your batter to test sweetness, since sweeteners vary in sweetness from brand to brand and your individual sensitivity to sweetness depends on how long you’ve been wheat-free. (The longer you’ve been wheat-free, the less sweetness you desire.)


Crust and crumble topping
3 cups almond meal
1 stick (8 tablespoons) butter, softened
1 cup xylitol (or other sweetener equivalent to 1 cup sugar)
1½ teaspoons ground cinnamon
1 tablespoon molasses
1½ teaspoons vanilla extract
Dash sea salt

Filling
16 ounces cream cheese, softened
2 large eggs
½ cup xylitol (or other sweetener equivalent to ½ cup sugar)
1 Granny Smith apple (or other variety)
1 teaspoon ground cinnamon
1 cup fresh cranberries

Preheat oven to 350° F.

In large bowl, combine almond meal, butter, sweetener, cinnamon, molasses, vanilla, and salt and mix.

Grease a 9½-inch tart or pie pan. Using approximately 1 cup of the almond meal mixture, form a thin bottom crust with your hands or spoon.

In another bowl, combine cream cheese, eggs, and sweetener and mix with spoon or mixer at low-speed. Pour into tart or pie pan.

Core apple and slice into very thin sections. Arrange in circles around the edge of the cream cheese mixture, working inwards. Distribute cranberries over top, then sprinkle cinnamon over entire mixture.

Gently layer remaining almond meal crumble evenly over top. Bake for 30 minutes or until topping lightly browned.
Cureality | Real People Seeking Real Cures

Wheat belly

You've heard of "beer bellies," the protuberant, sagging abdomen of someone who drinks excessive quantities of beer.

How about "wheat belly"?

That's the same protuberant, sagging abdomen that develops when you overindulge in processed wheat products like pretzels, crackers, breads, waffles, pancakes, breakfast cereals and pasta.


(By the way, this image, borrowed from the wonderful people at Wikipedia, is that of a teenager, who supplied a photo of himself.)

It represents the excessive visceral fat that laces the intestines and triggers a drop in HDL, rise in triglycerides, inflames small LDL particles, C-reactive protein, raises blood sugar, raises blood pressure, creates poor insulin responsiveness, etc.

How common is it? Just look around you and you'll quickly recognize it in dozens or hundreds of people in the next few minutes. It's everywhere.

Wheat bellies are created and propagated by the sea of mis-information that is delivered to your door every day by food manufacturers. It's the same campaign of mis-information that caused the wife of a patient of mine who was in the hospital (one of my rare hospitalizations) to balk in disbelief when I told her that her husband's 18 lb weight gain over the past 6 months was due to the Shredded Wheat Cereal for breakfast, turkey sandwiches for lunch, and whole wheat pasta for dinner.

"But that's what they told us to eat after Dan left the hospital after his last stent!"

Dan, at 260 lbs with a typical wheat belly, had small LDL, low HDL, high triglycerides, etc.

I hold the food companies responsible for this state of affairs, selling foods that are clearly causing enormous weight gain nationwide. Unfortunately, the idiocy that emits from Nabisco, Kraft, and Post (AKA Philip Morris); General Mills; Kelloggs; and their kind is aided and abetted by organizations like the American Heart Association, with the AHA stamp of approval on Cocoa Puffs, Cookie Crisp Cereal, and Berry Kix; and the American Diabetes Association, whose number one corporate sponsor is Cadbury Schweppes, the biggest soft drink and candy manufacturer in the world.

As I've said many times before, if you don't believe it, try this experiment: Eliminate all forms of wheat for a 4 week period--no breakfast cereals, no breads of any sort, no pasta, no crackers, no pretzels, etc. Instead, increase your vegetables, healthy oils, lean proteins (raw nuts, seeds, lean red meats, chicken, fish, turkey, eggs, Egg Beaters, low-fat yogurt and cottage cheese), fruits. Of course, avoid fruit drinks, candy, and other garbage foods, even if they're wheat-free.

Most people will report that a cloud has been lifted from their brains. Thinking is clearer, you have more energy, you don't poop out in the afternoon, you sleep more deeply, some rashes disappear. You will also notice that hunger ratchets down substantially. Most people lose the insatiable hunger pangs that occur 2-3 hours after a wheat-containing meal. Instead, hunger is a soft signal that gently prods you that it's time to consider eating again.

You will also make considerable gains towards gaining control over your risk for heart disease and your heart scan score, a crucial step in the Track Your Plaque program.

If health won't motivate them, maybe money will

As part of our ongoing effort to educate everyone about the value of heart scans and how they can serve to start a program of heart disease prevention (or elimination), we occasionally distribute press releases on one facet of this discussion or another.

Here's the one we released on our Cost Calculator, the one we developed that showed that $20 billion would be saved annually just by applying the program to men, ages 40-59.


Accurate Detection and Prevention of Heart Disease Can Reduce Healthcare Costs, According to New Cost Analysis

A new cost analysis developed by cardiologist Dr. William Davis and his colleagues suggests that healthcare costs can be reduced by billions of dollars with the application of a simple program for heart disease detection and prevention.

Milwaukee, WI (PRWEB) July 23, 2007 -- Billions of dollars in healthcare could be saved every year by applying a simple program of heart disease detection and prevention on a wide scale in the U.S., suggests a new cost analysis developed by cardiologist Dr. William Davis and colleagues. Davis and his colleagues are the developers of the Track Your Plaque program for heart disease detection and prevention.

In the next 24 hours, 10,000 major heart procedures will be performed in hospitals across the U.S. The tab for this bill will top $400 billion in 2007 alone, nearly twice the sum spent on the war on cancer.

As costs escalate at an alarming rate, tools for prevention of disease are also advancing. While drugs like Lipitor® make headlines and dominate direct-to-consumer TV ads, a quiet revolution is taking place among physicians and the public eager to find better answers, some of which also pose opportunities for stretching the healthcare dollar.

“We’re essentially throwing away billions of dollars each and every year by ignoring the savings power of preventive strategies for heart disease,” proclaims Davis, a Milwaukee cardiologist. Davis is author of several books on heart disease detection and prevention, has been a vocal advocate for preventive strategies and is founder of www.cureality.com.

Davis and his colleagues developed a cost model to predict how much money could be saved by the adoption of new preventive strategies on a broad scale in the U.S. “The cost savings are startling. If males in the 40–59-year-old age group, for instance, were to undergo a simple CT heart scan for early detection of coronary heart disease, followed by a purposeful yet focused program of prevention using widely available tools, our cost model shows that we would save the American public over $20 billion annually. Extending this calculation to the broader population would multiply savings several-fold.”

Heart care is already the single largest healthcare category in the U.S. As costs go up by double-digit percentages, fewer people can afford healthcare. Those who can afford it spend an increasingly greater portion of their disposable income to maintain it. The Agency for Healthcare Research and Quality predicts that, at the current rate of growth, healthcare costs will balloon to absorb 20 percent of American Gross Domestic Product (GDP), about $4 trillion, in the next 10 years.

Davis points out that reducing the annual U.S. expenditure for heart disease by 20 to 30 percent could save between $80 and $120 billion each year. That marginal savings exceeds the sum the U.S. spends on the domestic war on terror.

Davis and his group have dubbed the conventional procedure-based approach to heart disease management the “crash and repair model” because of its focus on urgent procedural intervention that takes place in hospitals.

The crash and repair model is costly. According to the American Heart Association, a heart catheterization (performed 3,553 times per day, seven days a week) costs an average of $24,893; a coronary bypass operation (performed 1,170 times every day, seven days a week) costs an average of $67,823 (hospital costs, 2004, the latest year for which data are available). These figures don’t incorporate long-term costs incurred in the years following the procedure or time lost from work.

The relatively high payment to physicians and hospitals for performing high-tech heart procedures provides a disincentive to redirect patients to a less costly prevention model. The exceptional costs of high-tech, high-ticket heart procedures would become increasingly unnecessary if better heart disease preventive practices were delivered on a broad scale. “Like seatbelts, preventive measures for heart disease are more cost effective and extract a far lower toll in human suffering than the ‘crash and repair’ approach. Our cost calculations bear out the enormous savings possible. In fact, all of the tools necessary to deliver a method of early heart disease detection and prevention are already available throughout the U.S. We’ve just got to encourage physicians and the public to take advantage of them.”

The cost calculator program can be found at http://cureality.com/library/fl_hh005bankrupt.asp on the cureality.com Web site.

Track Your Plaque is an informational and educational Web site devoted to showing people how CT heart scans can be used as a starting point for a program of heart disease prevention and reversal.

What role calcium supplements?

A frequent question in the Track Your Plaque program is whether taking calcium supplements to reduce risk for osteoporosis adds to calcium in arteries and raises CT heart scan scores.

No, calcium supplementation does not add to coronary calcium. Thankfully, there is some wisdom to calcium metabolism. Calcium deposition or resorption is under independent local control in bone, as it is in the artery wall. Taking calcium has no effect on calcium deposition in your coronary arteries.

However, there's a lot more to it. Taking calcium has only a modest effect on bone health. Most women can only hope to slow or stop calcium loss from bone by taking calcium supplements. Calcium supplements do not increase bone calcium. The reason why calcium supplementation works at all is, when calcium is absorbed into the blood, it provides a feedback signal to the parathyroid gland to shut down parathyroid hormone production, the hormone responsible for extracting calcium from bone. But the calcium itself does not end up deposited in bone.

Likewise, calcium supplements have essentially no effect on the artery wall. But vitamin D controls calcium absorption and, curiously, appears to exert a dramatic effect on calcium depostion in coronary arteries. In fact, I would credit vitamin D as among the most important factors in regulating arterial health that I've encountered in a long time.

Thus, bone health and arterial health do indeed intersect via calcium, but not through calcium supplements. Instead, the control exerted by vitamin D connects the seemingly unconnected processes.

Vitamin K2 provides another unexpected juxtaposition of the two processes. Deficiency of K2, which is proving to be a lot more common than previously thought, permits an enzyme in bone to exert unrestrained calcium extraction. Deficiency of K2 in artery walls allow another enzyme to deposit calcium and grow plaque without restraint. Yet another intersection between bone health and coronary health that involves calcium, but as a passive participant.

Stay tuned for a comprehensive Track Your Plaque Special Report on these topics coming in the next couple of weeks. I'm very excited about the emerging appreciation of calcium as an active ingredient in plaque, not a dumb, passive marker as previously thought. Vitamins D3 and K2 are among the keys to this phenomenon.

"Heart scans" are not always heart scans

Beware of the media reports now being issued that warn that "CT heart scans" pose a risk for cancer.

One report can be viewed at
http://www.webmd.com/cancer/news/20070717/ct-heart-scan-radiation-cancer-risk.

This was triggered by a Columbia University study of risk for cancer based on the dose of radiation used in CT coronary angiograms. Theoretically, exposure to the radiation dose of CT coronary angiography can raise risk for cancer by 1 in 143 women if radiated in their 20s just from that single exposure.

If you've been following the Track Your Plaque discussion, as well as my diatribes in the Heart Scan Blog, you know that the media got it all wrong. The "heart scans" they are referring to are not the same as the heart scans that we discuss for the Track Your Plaque program.

A conventional heart scan (of the sort we refer to) exposes the recipient to 4 chest x-rays of radiation if an EBT device is used, around 8-10 chest x-rays of radiation if a 64-slice CT scanner is used. For the quality of information we obtain from these screening heart scans, we feel that it's an acceptable exposure.

The "heart scan" this study and subsequent reports refer to is not truly a screening heart scan, but a CT coronary angiogram, or CTA. CTAs are performed on the same CT or EBT devices, but involve far more radiation. CTA exposes the recipient to about 100 chest x-rays of radiation on a 64-slice device (more or less, depending on the way it is performed.) Just a couple of years ago, some centers were performing CTA on 16-slice devices, a practice I and the Track Your Plaque program vocally opposed, since up to 400 chest-rays of radiation were required! I even called a number of centers advising them that they were putting the public in jeopardy. CTAs also require injection of x-ray dye, just like any conventional angiogram.

CTA on 64-slice CT scanners require the same radiation exposure as a conventional heart catheterization, an issue glossed over in most conversations. In other words, the test that many of my colleageus so casually recommend poses a similar risk.

The message: the test I advocate for screening for coronary heart disease is a CT or EBT heart scan, not a CT coronary angiogram. CTA is a useful test and will get better and better as the engineers discover ways to reduce radiation exposure. But, in 2007, CTA is a diagnostic device, not a screening device. If you require an abdominal CT scan because your doctor suspects pancreatic cancer, or a CT scan of the brain because you might have a life-threatening aneurysm causing double-vision or seizures, it would be silly to not undergo the scan because of long-term and theoretical cancer risk.

But undergoing a CT coronary angiogram for screening purposes is ridiculous with present technology. I've said it before and I will say it--shout it--again:

CT coronary angiograms are not screening procedures; they are diagnostic procedures that should be taken seriously and do indeed pose measurable risk for cancer, a risk that is presently unacceptable for a screening test.

You wouldn't undergo a mammogram to screen for breast cancer if it exposed you to 100 chest x-rays of radiation, would you? Screening tests should be safe, reliable, accurate, and inexpensive. CT coronary angiography is none of these things. Genuine heart scans--the kind the Track Your Plaque program talks about and relies on--is all of those things.

Heavy traffic and heart scans

A German study just reported in Circulation showed a graded response of EBT heart scan scores and proximity to traffic.

Living 50 meters (around 150 feet) from traffic increased the likelihood of a higher coronary calcium score by 63% compared to those living 200 meters (around 600 feet or two football fields) away from traffic.

A sample news story can be found at http://healthday.com/Article.asp?AID=606431.

The German investigators speculated that either the heightened exposure to exhaust fumes and/or the increased stress triggered by the constant noise might be the culprits behind the phenomenon.

I think the study is interesting in a number of ways from the Track Your Plaque viewpoint:

--Sometimes, there are factors that extend beyond lipoproteins, vitamin D restoration, optimism vs. pessimism, etc. that influence heart scan scoring. Are these factors powerful enough to overcome the adverse effects of traffic or other environmental effects? Can your proximity to traffic make or break your heart scan score-controlling efforts? This remains to be established.

--How much of a role does the stress issue play? Is this just a variation of the optimism vs. pessimism theme? I know when I'm in traffic in a car or on a bicycle, it often feels like I am at the mercy of hordes of people in a hurry, the soccer Moms on cell phones, applying makeup and eating, the hormonal teenager, the occasional drunk. Living in the midst of it must be demoralizing, a sense that you are lost in a sea of uncaring humanity stripped of individuality. When I look outside my den window right now, I see the lawn that I cut and water and the flowers and evergreen trees I've planted over the years. It provides a sense of life, belonging, and earth. What if instead I saw anonymous cars buzzing by, dozens of unfamiliar faces every minute, none of which plays any palpable role in my life?

--This simple observation will add to the healthy-consciousness and Green movements, since it is just one more piece of evidence that congestion and urbanization do indeed take their toll. In an obtuse way, I think this is one step closer to increasing disillusionment over the "over-processing" of human experience: processed foods, depersonalization and alienation in neighborhoods and homes, the dissolution of the American family.

Lastly, notice how the conversation about CT (in this case, EBT) heart scanning has seamlessly worked its way into conversation? Just ten years ago, a long-winded explanation would have been required in press reports on just what CT heart scanning was. Now, the information is presented and--well, we all know what heart scanning is, right?

A small study but one that comes at an important time. Good things will come from this one study. It will work its way into discussions about where to locate schools, how to situate homes in relation to heavy traffic, it will help "legitimize" this wonderful tool called heart scanning. How many medical tests beyond blood work can be easily performed in 4500 study participants?

I always like to take some simple observation and see how it fits into developing trends. Few studies or other human-generated experiences by themselves change the world. Instead, it happens in little incremental bits and pieces.

Digging for the truth

I remain continually amazed how difficult it can be to gain an understanding of what is true and what is not true. I am particularly worried about the messages provided by agencies that stand to make enormous gains by persuading us to believe their version of the "truth".

For a moment, let's strip away the charitable covers of some financially-motivated organizations and see what they really look like:


Hospitals: The dream of hospitals is to shift the proportion of patients towards those with the most profitable diseases in well-insured patients. Heart disease is among the best paying diseases. HOSPITALS WANT YOU TO HAVE HEART DISEASE.

Doctors: Many (though not all) want to deal with diseases that pay well. Implanting a stent can pay several thousand dollars. Putting in a defibrillator can likewise pay handsomely, even better than stents. DOCTORS WANT TO STEER YOU TOWARDS PROCEDURES THAT REIMBURSE GENEROUSLY. Talk is cheap and pays poorly. Heart scans? Useless, since they're cheap. CT angiography? Now we're talking! $1800 dollars is a lot more interesting than $200 or so for a simple heart scan. CT angiograms also lead to catheterization, stents, hospitalizations.

Drug manufacturers: The holy grail for drug manufacturers is a chronic condition that is present in large numbers of people. An antibiotic, for instance, is a drug manufacturers waste of time: Short courses of treatment in relatively few people. Cholesterol drugs, blood pressure drugs, drugs to modify personality or some aspect of behavior--these you take for years, decades, or a lifetime, and millions are persuaded they need them. DRUG COMPANIES WANT CHRONIC CONDITIONS (WHETHER OR NOT THEY'RE DISEASES) IN PEOPLE WHO SURVIVE FOR A LONG TIME, NOT SICK PEOPLE.

Supplement manufacturers: What don't we need in the eyes of sellers of nutritional supplement? While a program like Track Your Plaque makes liberal use of supplements in a focused and, I believe, rational way, supplement sellers want you to take dozens or preparations of dubious value: milk thistle, hawthorne, ribose, hoodia, silymarin, hydroxycitric acid . . . Unlike the larger ambitions and bigger money of the pharmaceutical industry, the supplement industry is often driven by the momentary craze and the quick payoff. THE SUPPLEMENT INDUSTRY IS LOOKING FOR SUCKERS.

Food manufacturers: The holy grail for the food industry are foods that have high markups, are convenient (e.g., eaten right out of the box or package), and are purchased repeatedly. Even better, if a health claim can be added, it can ride the current wave of the public's health consciousness. Thus, Cocoa Puffs can be labeled "Heart Healthy". How about foods that have addictive potential and virtually ensure repeat sales? Eat some and you want more within 2-4 hours! As nutritionist Marion Nestle says, the mantra of the foods industry is "Eat More". It is my firm conviction that the epidemic of obesity in the U.S. is not due to laziness, video games, and computers. It is the fault of food manufacturers. FOOD MANUFACTURERS WANT US FAT AND HUNGRY AND WANT US TO STAY THAT WAY. What pays better, a 110 lb vegetarian woman who shops at the farmer's market and buys locally produced foods, or the 260 lb glutenous and always-hungry woman who fills her supermarket shopping cart with 15 cents worth of flour and sugar priced at $4.59 (cleverly disguised as a healthy breakfast cereal), instant mixes, convenient meals, energy bars, and chips?

Government agencies: User fees for the FDA paid by drug companies have caused the FDA to be beholden to drug company pressures. The USDA, charged with crafting the food pyramid, was created to support the farm industry and distributors of their products, not to disseminate public health. The food pyramid is the watered down end result of food industry lobbying and threats, not the scientific advice of nutritionists. GOVERNMENT AGENCIES SERVE INDUSTRY FIRST, THE PUBLIC SECOND.

Health websites: Read popular websites like WebMD for information and the conversation quickly steers towards drugs. "Natural treatments for cholesterol" talks about reducing saturated fat and then gushes about the wonders of statin drugs. Guess where 80% of WebMD's revenues come from? Yup, the drug industry. The same goes for many magazines, TV shows, and other media. MEDIA IS OFTEN THE TOOL OF BIG INDUSTRY.


I'm sounding like a conspiracy theorist. I don't believe that I am, but I am skeptical of the messages we often receive from the media, advertisements, news reports, websites, etc. It's left to you and me to use our judgment and decide what is truth and what is someone's version of a message crafted towards their hidden agenda.

I am hoping that the real truth will grow through a wiki-like phenomena driven and supervised by a collective knowledge that we all contribute towards. That will happen, most likely, on the internet. Just as Wikipedia overtook the revered Encylopedia Britannica in the blink of an eye at far less cost yet with greater depth and equivalent accuracy, so will it happen in health information. I'm uncertain of the eventual form this health-wiki will take, but it will shatter many smug and deeply-entrenched powers that at present continue to profit from mis-information.

A new Track Your Plaque record: 63% reduction

Stress can booby-trap the best efforts at reducing your CT heart scan score.

But Amy, our newest Track Your Plaque record holder, defied the effects of an overwhelmingly life stress to drop her heart scan score from 117 to 43--an amazing 63% reduction.

Amy beat our previous record holder, Neal, who achieved a 51% reduction. Though Neal had dropped his score from 339 to 161, a drop of 178 and more than Amy's 74 point drop, on a percentage basis Amy holds the record.

I'm also especially gratified that a woman now holds our record. I'm uncertain why, but the ladies have been shy and the men remain the dominant and vocal participants in our program. Speak up, ladies!

Amy's complete story can be found in our latest Track Your Plaque Newsletter to be released later this week, as well as an upcoming feature on the www.cureality.com website. (We've got to toot our horn about successes like this!)

The Ornish diet made me fat

I got that kind of question today that tempts me to roll my eyes and say, "Not again!"

"If I want to reverse my heart scan score, should I do the Ornish diet?" You know, the one by Dr. Dean Ornish: Dr. Dean Ornish's Program for Reversal of Heart Disease.

I personally followed the Ornish program way back in the early 1990s. I reduced fat intake of all sorts to <10% of calories; eliminated all fish and meats, vegetable oils, and nuts; ate vegetables and fruits; and upped my reliance on whole grains. I used many of his recipes. I exercised by running 5 miles per day. (Far more than I do now!) I avoided sweets like candies and fruit juices.

What happened?

I gained 31 lbs, going from 155 to 186 lbs (I'm 5 ft 8 inches tall), my abdomen developed that loose, fleshy look, hanging over my beltline. My HDL plummeted to 28 mg/dl, triglycerides skyrocketed to 336 mg/dl, and I developed a severe small LDL pattern. I experienced a mental fogginess every afternoon. I felt tired and crabby much of the time. I sometimes struggled to suppress an irrational anger and frustration over the silliest things. I required huge amounts of coffee just to function day to day.

Hundreds of my patients suffered similar phenomena.

Few of us wear bell-bottomed jeans, tie-dyed t-shirts, or say "groovy". Rowan and Martin's Laugh-in is an "oldie", it's no longer cool to hold your index and middle fingers up in the "V" sign of peace. Even Ladybird Johnson has passed.

So should go the misadventures of the ultra low-fat diet, as articulated by Dr. Ornish. His day came and went. We learned from our mistakes. Now let's do something better.

Keep your eyes open for the New Track Your Plaque Diet.

Do lower heart scan scores grow faster?

If Mary's heart scan score increases from 2 to 4 in one year, it represents a 100% increase in score.

If Jane's heart scan score increases from 1002 to 1004 over the same period, it represents <1% increase, even though the true growth is the same: 2 points.

This quirk of arithmetic needs to be factored in whenever you and your doctor try to puzzle out the meaning of an increasing CT heart scan score. Lower numbers, particularly those <100, can grow at seemingly much faster rates if viewed by percent per year increase. If no effort is taken to stop the growth in your coronary plaque, then scores of 10, 20, 30, or the like can easily grow 50-100% per year.

In contrast, scores of 1000, 1500, and 2000 tend to grow at "slower" rates of 20% or so per year without corrective efforts, even though the absolute growth may be substantial. (Obviously, this bit of confusion can be best eliminated by reducing your heart scan score, but it doesn't always work out that way.)

If we were all adept at advanced math, we should probably rely on logarithmic measures of plaque increase, rather than percent increase. Or, you can just keep in mind that the rate of plaque growth must always be viewed in the context of the absolute score.

Mr. Salazar: Check your Lp(a)

Marathon star Alberto Salazar was just released from the hospital following a heart attack and a heart catheterization that led to a stent. The MSNBC version of the report can be viewed at http://www.msnbc.msn.com/id/19653682/.

At 48 years old and holder of several American records for marathon times, Salazar's story is eerily reminiscent of Jim Fixx, who died at age 52 after writing a bestselling book, The Complete Book of Running. Thankfully, Salazar's story has a happier ending.

Fixx died at a time when prevention of heart disease was quite primitive. Lipoprotein analysis was not broadly available to the public, CT heart scans had not yet been invented. Even statin drugs were just a gleam in the pharmaceutical industry's eye.

But not so with Salazar. This Cuban-born marathoner experienced his heart attack at at a time when enormously useful steps can be taken to 1) document the extent of disease with a CT heart scan (the presence of a stent just means that one artery can't be "scored"), and 2) identify the causes of his disease.

I suspect that the fact that yet another marathoner in the limelight will once again prompt the (likely non-sensical) conversation about long-distance running and the increased risk of heart disease. Unfortunately, I fear that the real cause will be left unidentfied and untreated: Lipoprotein(a), or Lp(a).

It's almost certain that Fixx had Lp(a), given the fact that his dad had a heart attack at age 35. Running simply postponed the untreated inevitable.

I hope Mr. Salazar is surrounded by doctors who have his true interests in mind (not just procedural excitement) and ask the crucial question: Why?

The answer is almost certain to be Lp(a).

Copyright © 2026 Cureality.com

All posts by william-davis

Why does wheat cause arthritis?

Wheat causes arthritis.

Before you say "What the hell is he saying now?", let me connect the dots on how this ubiquitous dietary ingredient accelerates the path to arthritis in its many forms.

1) Wheat causes glycation--Glycation is glucose-modification of proteins in the body that occurs when blood glucose exceeds 100 mg/dl. Cartilage cells are especially susceptible to glycation. The cartilage cells you had at age 18 are the very same cartilage cells you have at age 60, since they lack the ability to reproduce and repair themselves. Proteins in cartilage are highly susceptible to glycation, which makes them stiff and brittle. Stiff, brittle cartilage loses its soft, elastic, lubricating function. Damaged cartilage cells don't regenerate nor produce more protective proteins. This allows destruction of cartilage tissue, inflammation, and, eventually, bone-on-bone arthritis.

Because wheat, even whole wheat, sends blood sugar higher than almost all other foods, from table sugar to Snickers bars, glycation occurs after each and every slice of toast, every whole wheat bagel, every pita wrap.

2) Wheat is acidifying--Humans are meant to consume a diet that is net alkaline. While hunter-gatherers who consume meat along with plentiful vegetables and fruits live a net alkaline diet (urine pH 7 to 9), modern humans who consume insufficient vegetables and too much grain (of which more than 90% is usually wheat) shift the body towards net acid (urine pH 5 to 7). Wheat is The Great Disrupter, upsetting the normal pH balance that causes loss of calcium from bones, resulting in decalcification, weakness, arthritis and osteoporotic fractures.

3) Wheat causes visceral fat--The extravagant glucose-insulin surges triggered by wheat leads to accumulation of visceral fat: wheat belly.

Visceral fat not only releases inflammatory mediators like tumor necrosis factor and various interleukins, but is also itself inflamed. The inflammatory hotbed of the wheat belly leads to inflammation of joint tissues. This is why overweight and obese wheat-consuming people have more arthritis than would be explained by the burden of excess weight: inflammation makes it worse. Conversely, weight loss leads to greater relief from arthritis pain and inflammation than would be explained by just lightening the physical load.

We need a name for this wheat effect. How about "bagel bones"?

Why do morphine-blocking drugs make you lose weight?

Naloxone (IV) and naltrexone (oral) are drugs that block the action of morphine.

If you were an inner city heroine addict and got knifed during a drug deal, you'd be dragged into the local emergency room. You're high, irrational, and combative. The ER staff restrain you, inject you with naloxone and you are instantly not high. Or, if you overdosed on morphine and stopped breathing, an injection of naloxone would reverse the effect immediately, making you sit bolt upright and wondering what the heck was going on.

So what do morphine-blocking drugs have to do with weight loss?

An odd series of clinical studies conducted over the past 40 years has demonstrated that foods can have opiate-like properties. Opiate blockers, like naloxone, can thereby block appetite. One such study demonstrated 28% reduction in caloric intake after naloxone administration. But opiate blocking drugs don't block desire for all foods, just some.

What food is known to be broken down into opiate-like polypeptides?

Wheat. On digestion in the gastrointestinal tract, wheat gluten is broken down into a collection of polypeptides that are released into the bloodstream. These gluten-derived polypeptides are able to cross the blood-brain barrier and enter the brain. Their binding to brain cells can be blocked by naloxone or naltrexone administration. These polypeptides have been named exorphins, since they exert morphine-like activity on the brain. While you may not be "high," many people experience a subtle reward, a low-grade pleasure or euphoria.

For the same reasons, 30% of people who stop consuming wheat experience withdrawal, i.e., sadness, mental fog, and fatigue.

Wouldn't you know that the pharmaceutical industry would eventually catch on? Drug company startup, Orexigen, will be making FDA application for its drug, Contrave, a combination of naltrexone and the antidepressant, buproprion. It is billed as a blocker of the "mesolimbic reward system" that enhances weight loss.

Step back a moment and think about this: We are urged by the USDA and other "official" sources of nutritional advice to eat more "healthy whole grains." Such advice creates a nation of obese Americans, many the unwitting victims of the new generation of exorphin-generating, high-yield dwarf mutant wheat. A desperate, obese public now turns to the drug industry to provide drugs that can turn off the addictive behavior of the USDA-endorsed food.

There is no question that wheat has addictive properties. You will soon be able to take a drug to block its effects. That way, the food industry profits, the drug industry profits, and you pay for it all.

Heart scan tomfoolery 2

In the last Heart Scan Blog post, I discussed the significance of the apparent discrepancy between Steve's heart scan score and volume score. This post addresses his second question, also a FAQ about heart scan scores.

Steve noted that his second scan compared to his first showed:

- Left Main volume went up from 22.4 to 35.6
- LAD went down from 95.2 to 91.3
- LCX volume went down from 23.2 to 0
- RCA volume went up from 0 to 9.3

So there are apparent divergences in behavior in the left main that increased and both LAD (left anterior descending) and LCX (left circumflex) that decreased.

The explanation is simple: When heart scans are "scored," they are viewed in horizontal "slices." When the heart is viewed as horizontal slices, the LAD and LCX originate from the common left main stem. In other words, it's like a tree with the left mainsteam representing the trunk, the LAD and LCX representing two main branches.

Plaque can form, obviously, in all three arteries, but it can do so by starting in the left main, for instance, and extending into either the LAD or LCX, or both. The left main plaque can therefore bridge any 2 or all 3 arteries.

When the plaque is "scored" by taking the computer mouse and circling the calcified plaque in question (to allow the computer program to generate the calcium score and volume score of that particular plaque), the plaque that may extend from left main into the LAD and/or LCX might be labeled "left main," or it might be labeled "LAD" or "LCX." There is no reliable way to "dissect" apart the plaque into the three arteries, since the plaque is coalescent and continuous. So the scoring technologist or physician simply arbitrarily declares the artery "LAD," for instance.

The problem comes when two different interpretation methods are used: Perhaps it's a new technologist or physician, or there was no attention paid to how the previous scan was read. One reader calls it "left main" and the next calls it "LCX."

So the apparent discrepancy has to do with flaws in the methods of segregating plaque location, as well as inattention to scoring techniques. The total score, however, remains unaffected.

Nonetheless, Steve has enjoyed a modest reduction in the score of the left main/LAD/LCX from his original 140.8 down to a second left main/LAD/LCX score of 126.9.

The right coronary artery (RCA), however, is not subject to this difficulty and Steve score shows a modest increase in score. (Why the divergent behavior between left main/LAD/LCX and RCA? There is no clear explanation for this, unfortunately.)

All in all, the news for Steve is good: He achieved these results on his own using nutritional techniques. Because he, in all practicality, stopped the progression of his heart scan score and avoided the "natural" rate of increase of 30% per year, all he needs to do is "tweak" his program a bit to achieve reversal, i.e., reduction of score.


Here's an image from another previous Heart Scan Blog post (about the relationship of osteoporosis and coronary disease) that shows such a plaque that starts in the left mainstem yet extends into both the LAD and LCX:

Heart scan tomfoolery

Heart Scan Blog reader, Steve, sent these interesting questions about his heart scan experience. (I sometimes forget that this blog is called "The Heart Scan Blog" and was originally--several years ago--meant to discuss heart scans. It has evolved to become a much broader conversation.)

The answers are a bit lengthy, so I'll tackle Steve's questions in two parts, the second in another blog post.

Dr. Davis,

I had a heart scan last year. The score was 96. While not a horrible score, it
was a wake up call, and I changed my lifestyle.

I had another scan this year and the heart scan score went up to 105, but the
volume score went down from 141 to 136.

The report I received said this:

'The calcium volume score is less in the current study as compared with the
original or reference study. This is an excellent coronary result and indicates
that there has been a net decrease in coronary plaque burden. The current
prevention program is very effective and should be continued.'

This is all well and good, but I have two questions:

1. Am I really going in the right direction even though the heart scan score
went up 9%?

2. Here are results that make no sense to me:
- Left Main volume went up from 22.4 to 35.6
- LAD went down from 95.2 to 91.3
- LCX volume went down from 23.2 to 0
- RCA volume went up from 0 to 9.3

Why would there be so much variation from year to year, and why would the plaque
move from site to site?

Steve


Questions like Steve's come up with some frequency, so I thought it would be worthwhile to discuss in a blog post.

First of all, the conventional heart scan score, or "calcium score" or "Agatston score" (after Dr. Arthur Agatston, developer of the simple algorithm for calcium scoring, as well as South Beach Diet fame), is the product of the area of the plaque in a single CT "slice" image
multiplied by a density coefficient, i.e., a number ranging from 1 to 4 that grades the x-ray density of the plaque. (1 is least dense; 4 is most dense.) A density coefficient of 1 therefore signifies some calcium within plaque, with higher density coefficients signifying increasing calcium content and density. Incidentally, "soft" plaque, i.e., non-calcified, would fall in the less than 1 range, even the negative range (fatty tissue within plaque).

The volume, or "volumetric," score is the brainchild of Drs. Paulo Raggi and Traci Callister, who expressed concern that, if we cause plaque to shrink in volume, the density coefficient used to calculate the calcium score would increase (since they believed that calcium could not be reduced, contrary to our Track Your Plaque experience, thereby leading to misleading results. They therefore developed an algorithm that did not rely on density coefficients, but used the same two-dimensional area obtained in the standard heart scan score, but replaced the density coefficient with a (mathematically interpolated) vertical axis (z-axis) measure of plaque "height." This 3-dimensional volumetric value therefore provided a method to generate a measure of calcium volume. In their original publication, the volume score proved more reproducible than the standard calcium score. This way, any reduction in plaque volume would not be influenced by the misleading effects of calcium density, but reflect a real reduction in volume.

Callister and Raggi's study also highlighted that calcium scoring in any form is subject to variability. Back in 1998 (when their study was published), there was a bit more variation than today due to the image acquisition methods used. But, even today, there is about 9% variation in scoring even if performed repeatedly (with less percentage variation the higher the score).

Unfortunately, volume scoring never caught on and the calcium score has been the most commonly used value by most heart scan centers and in most clinical studies. And, in all practicality, the two values nearly always track together: When calcium score increases, volume score increases in tandem; when calcium score decreases, volume score decreases in tandem.

Steve is therefore an exception to the general observation that calcium score and volume score travel together. Steve's calcium score increased, while his volume score decreased. From the above discussion, you can surmise a few things about Steve's experience:"

1) In all likelihood, the changes in both calcium score and volume score could simply be due to variability, i.e., variation in the placement of his body on the scan table, variation in position of the heart, variation in data acquisition, etc. There is a high likelihood that neither value changed; both are essentially unchanged.

2) If the changes are not due to scan variability, but are real, then it could be that the calcified plaque is reduced in volume but increased in density. If true, this is probably still a favorable phenomenon, since plaque volume is a powerful predictor of coronary "events" and an increase in plaque density is likely a benign phenomenon. It would also raise questions about the adequacy of vitamin D and vitamin K2 status, both major control factors over calcium deposition and metabolism.

So, in all likelihood, Steve's apparent discrepant results are modest good news, especially since calcium scores can ordinarily be expected to increase at the rate of 30% per year if no action is taken. Experiencing no change in score, calcium or volumetric, carries a very All posts by william-davis

Optimal medical therapy

I was re-reading some of the details behind the recently announced COURAGE Trial comparing angioplasty/stent in 1100 people compared to "optimal" medical therapy in another 1100. You'll recall that no difference was found.

In particular, over approximately 5 years, 20% of participants in each group died, experienced heart attacks, or strokes. Of those treated with "timal" medical therapy, 32% ended up getting a procedure like stents or bypass anyway due to deteriorating symptoms.

What is "optimal" medical therapy? I bring this up again because the study investigators in COURAGE, as well as in similar trials, say this with a straight face. Optimal medical therapy means aspirin and/or Plavix (the anti-platelet, aspirin-like blood thinner); "aggressive" statin drug therapy to reduce LDL cholesterol to 60-85 mg/dl; and "anti-ischemic" therapy (that reduces angina and the phenomena of poor coronary blood flow) using nitroglycerin preparations, beta blockers, and other drugs.

I do give credit to the investigators for having the courage to perform this trial in a world hell bent on doing procedures and still reporting the neutral outcome. But the notion of "optimal" medical therapy begs for comment.

Indeed, this is regarded as optimal by most practitioners. Some would even argue excessive, based on the low LDL target achieved. Would you be satisfied with a 20% likelihood of heart attack, stroke, or death or 5 years, a 1 in 5 roll of the dice? I would not. Recall that we aim for near-total elimination of risk.

What could have been further "optimized"? Plenty. For instance:

--What is the real LDL, not the fabricated, calculated LDL? The two can be commonly 100 mg/dl different.

--How about raising HDL to 60 mgd/?

--What about reducing the proportion of small LDL particles? After all, small LDL is the number one cause of heart disease in the U.S., not high LDL.

--What is Lp(a)? If you treat LDL with a statin drug, Lp(a) is unaffected and continues to trigger huge plaque growth. You will fail if this is not identified and corrected.

--What is vitamin D3? One of the most powerful facilitators of plaque reversal I know of.

--What are triglycerides? Triglycerides create hidden particles in the blood like intermediate-density lipoprotein, potent triggers for coronary plaque growth. Speaking of intermediate-density lipoprotein, that's another very important pattern to identify, the after-eating persistence of dietary fats.

--Why aren't they taking fish oil? With a 28% reduction in heart attack and 45% reduction in sudden death from heart attack, this alone would have halved the number of "events" in the "optimal" medical treatment group.

Of course, there's more. But the idea that aspirin, statins, and anti-ischemic therapy is somehow optimal is silly and sad at the same time. But that's the bias. The COURAGE Trial does represent a step forward, a step away from the "stent everyone and everything" mentality that motivates my colleagues, aided and abetted by their co-conspirators, the hospitals. But you and I know better. "Optimal" medical therapy, in truth, can mean a far better approach that can dramatically reduce, perhaps eliminate, risks for events like heart attack. The conventional "optimal" medical therapy will suffice only if you're content with a 20% likelihood of heart attack, death or stroke, or a 32% likelihood of an urgent procedure in your future.

Niacin, postprandial patterns

For a detailed report on the very important postprandial (after eating) patterns that contribute hugely to heart disease risk, read my recent article in Life Extension Magazine, available (no cost) at:

Uncovering a Hidden Source of Cardiovascular Disease Risk
at http://www.lef.org/magazine/mag2007/mar2007_report_heart_01.htm


For a report on using niacin to reduce risk of heart disease, see another report in the same issue of Life Extension:

Ask the Doctor: Using Niacin to Improve Cardiovascular Health
at
http://www.lef.org/magazine/mag2007/mar2007_atd_01.htm.

Also, keep your eyes open for a lengthy report focused exclusively on the Track Your Plaque program in an upcoming issue of Life Extension. I'll provide links in this Blog when it comes out.

What's better than fish oil?

One of the recent questions on our Track Your Plaque Forum related to what to do about a triglyceride level of 101 mg/dl while on fish oil.

Recall that, contary to conventional thinking like that articulated in the ATP-III cholesterol treatment guidelines, we aim to reduce triglycerides to 60 mg/dl or less. This is important to suppress the formation of abnormal triglyceride-containing lipoprotein particles, especially small LDL, reduced HDL, lack of healthy large HDL, VLDL. ATP-III advises a level of 150 mg/dl or less. Unfortunately, triglyceride levels this high guarantee appearance of all these undesirable particles and an increasing heart scan score.

What's better than 4000 mg of fish oil for its 1200 mg of EPA and DHA (omega-3 fatty acids)? More fish oil. In other words, the 4000 mg fish oil providing 1200 mg EPA + DHA is our minimum. A simple increase to 6000 mg to provide 1800 mg EPA + DHA is usually all that is necessary to reduce triglycerides and put a halt to the cascade of abnormal lipoprotein particles that trigger plaque growth. Occasionally, a somewhat higher dose may be required. Doses are best divided into two, with meals (e.g., three capsules twice a day).

Another important issue: An over-reliance on wheat products can also increase triglycerides. This includes any flour product like breads (regardless of whether it's white, whole wheat, or whole grain--they all raise triglycerides), pretzels, bagels, breakfast cereals, and pasta. A dramatic reduction in wheat-containing products will reduce triglycerides substantially, help you reduce your abdominal fat, reduce blood pressure, raise HDL and reduce small LDL, clear your mind, provide more energy, avoid afternoon "fogginess" . . . Huge benefits.

Valve disease and vitamin D

There are two common forms of heart valve disease: aortic valve stenosis (stiffness) and insufficiency (leakiness), and mitral anular calcification.

Both valve issues are regarded as evidence of senescence, or aging--the older you are, the more likely you will have one or both. Both conditions involve progressive calcium deposition and, to some degree, cholesterol deposition. They might be regarded as phenomena of "wear and tear" just like hip arthritis.

There are no known therapies to stall or stop the development of mitral anular calcification. However, several attempts have been made over the years to identify treatments that can slow or stop the progression of aortic valve disease, which is becoming increasingly common and is addressed by surgical valve replacement when severe. The most recent trials have examined whether high-dose Lipitor (80 mg) has any effect (it did not) and high dose Crestor (40 mg), which slowed but did not stop the deterioration of stiff valves.

It's been my suspicion that vitamins D and K2 may play a crucial factor in valve health. After all, vitamin D is the master controller of calcium deposition. Preliminary data also suggest that people who are intentionally made vitamin K deficient with the drug, Coumadin, develop twice the calcium deposition on aortic valves that non-Coumadin takers develop.

I saw a patient Friday, Marianne. In addition to a moderate heart scan score of 379 at age 71, Marianne had a leaky (insufficient) aortic valve. By an echocardiogram 18 months ago, the valve was moderately leaky. I put Marianne on vitamin D, 4000 units, to raise her blood level to 50 ng/ml.

Last week, I asked Marianne to have another echocardiogram. This time, no leakiness whatsoever--none. I have never seen this happen before. Although Marianne is only one example and we don't want to extrapolate too far from the experience of one person, it's hard not to attribute this phenomenal response to vitamin D supplementation.

I wonder what would have happened if we had added vitamin K2, as well?

Anyway, just another potential wonderful effect of vitamin D restoration.

Homocysteine and coronary plaque

If you’ve watched the news over the past year, you know that doubt has been cast over the idea that reducing homocysteine blood levels with high doses of B vitamins (B6, B12, and folic acid, or B9) results in reduced risk for heart attack.

Is the homocysteine concept dead? Shall we empty our bottles of costly B vitamins into the trash and move on?

I don’t think so. As detailed in one of our Track Your Plaque Special Reports from a few months ago, I think the homocysteine issue still deserves lots of respect and further investigation. After all, hundreds of clinical studies have connected higher homocysteine levels with greater risk for heart disease, stroke, and aneurysm. Numerous studies, for example, have repeatedly and consistently demonstrated a tripling of heart attack risk when homocysteine levels exceed 14 ?mol/l. Can we dismiss this association because several more recent studies—NORVIT, HOPE, and VISP—suggested that, when starting homocysteine levels are 12.5, that B vitamin supplementation does not reduce heart attack risk?

I think there’s lots more to know about the homocysteine connection. That said, I have never seen a patient who I thought had heart disease strictly because homocysteine was increased.

I believe that we can at least use homocysteine as an index of lifestyle: the higher the homocysteine, the poorer the diet, or the less effective the absorption of B vitamins (especially vitamins B12 and folic acid). Homocysteine levels of <9 micromol/l suggest both adequate intake and absorption of these B vitamins.

If homocysteine is tightly connected with risk for heart disease, yet supplementation of B vitamins fails to reduce risk, might there be another means of connection? Or, could both homocysteine and heart disease be connected in some way that has nothing to do with B vitamins?

Don’t close the book on homocysteine. Just because conventional experience fails to draw connection does not necessarily mean that none exists. If it’s any consolation, taking B vitamins has been correlated with better memory, concentration, and other health benefits, even if no reduction in heart disease develops.

Big heart scan scores drop

High heart scan scores of, say, greater than 1000 are more difficult to reduce than lower scores.

I learned this lesson early in the experience of trying to drop scores. In the first few years of trying to drop scores, I saw relatively modest scores of 20, 50, or 100 drop readily, even when the usual targets were not fully achieved, and even before the incorporation of some of the more exciting recent additions to the Track Your Plaque program, like vitamin D.

But big scores of 1000, 2000, or 3000 are a tougher nut to crack. In the first few years, what I usually saw was a slowing , or "deceleration," of growth from the expected rate of annual score increase of 30% that would continue for a year or two, followed by zero change. In the first year of effort, for example, a score increase of 18% was common. 10% was common in year two, then finally zero change in year three. Somehow, the more plaque you begin with, the more "momentum" in growth is present and the longer it takes to stop it. Kind of like stopping a compact car versus stopping a freight train.

But more recently, I'm seeing faster drops. Today, Charlie came to the office to discuss his second heart scan. 18 months earlier, Charlie's first scan showed a score of 3,112, high by anybody's standard.

His repeat score: 3,048. While the drop is relatively small on a percentage basis and may even fall within the expected rate of error for heart scans (which tends to be <2% at this high a score), I told Charlie that it still represented a huge success. Not only did he not increase his score by the expected 30% per year, he also brought a charging locomotive to a rapid stop.

Next year, Charlie is targeting a big drop. Given the tools he now has available, I'm optimistic that he will succeed.

Watch for the Track Your Plaque May, 2007 Newsletter in which we will detail Charlie's story further.

Does the American Heart Association diet reduce heart disease?

If you have a heart attack and land in the hospital where, invariably, you will have a heart procedure. Or, if you get a stent or coronary bypass operation, sometime before your discharge from the hospital, a well-meaning hospital staff dietitian will provide instruction in the American Heart Association (AHA) diet.

Does this diet reduce the risk of heart disease?

The answer depends on where you start. If you begin with a conventional American diet that is enormously influenced by convenience, food manufacturers like Nabisco, General Mills, Quaker Oats, ADM, and Cargill, or food distributors like McDonald’s, Pizza Hut, and Taco Bell, then the American Heart Association diet is indeed an improvement. But just a small one. If LDL cholesterol is the yardstick, the average reduction in LDL is between 10 and 15 mg/dl. This is the same amount of change you’d experience by adding 1 tablespoon of oat bran to your diet. Hardly worth boasting about. HDL, triglycerides, blood glucose, and body weight do not change.

The diet could be substantially better. After all, it’s become common knowledge that other diets, such as the so-called Mediterranean diet, the South Beach Diet, and similar broad projects result in far greater changes than the AHA diet dispensed by your hospital and cardiologist. These diets more effectively reduce LDL, raise HDL, reduce triglycerides, reduce C-reactive protein, reduce blood pressure. Diets like South Beach also yield substantial weight loss and reversal of diabetic tendencies, with the magnitude of benefit dependent on the amount of weight lost.

Why this stubborn adherence to the outdated concepts articulated in the AHA diet? Cardiologists would argue that insufficient data has been generated to permit widespread application of these diets. They also differ on whether they really work. Of course, the majority remain ignorant and dismiss them as fad diets.

A little digging into the financial disclosures of the AHA suggests another, more malignant influence: who is paying the bills? Until recently, drug manufacturers were major contributors to the AHA. However, more recently AHA administrators have become sensitive to the public perception that they might be nothing more than a voice box for the drug industry. They have since limited contributions from the drug companies to 8% of annual charitable revenues.

The drug manufacturers have been replaced by the food industry. In addition to food manufacturers that make the cereals on your grocery shelf, it includes the multi-national conglomerates that produce unimaginable revenues and carry enormous political clout, like ADM and Cargill. Ever wonder how it is that Honey Nut Cheerios received a “Heart Healthy” endorsement from the AHA?

The AHA diet does not provide the answers we’re looking for, not even close. It is a perversion from an organization that has its strings pulled by industry. The answers to health will not come from the AHA, AMA, the American College of Cardiology, the American Hospital Association, and it won’t come from your doctor. It won’t come from a titillating report on the evening news or Good Morning America. It will come from collective and expanding wisdom placed directly into the hands of the public. It will be untainted by the temptation of drug industry dollars. It will not be dirtied by million dollar contributions, or the multi-million dollar behind-closed-doors lobbying of the food manufacturers. It will come from the truth relayed to the healthcare-consuming public. I hope you recognize it when you see it.

If you want a healthy diet for your heart, throw away the pamphlets from the AHA unless you are partial to bread, breakfast cereals, corn, and the supporters of their misguided nutritional advice.

Vitamin K2 and coronary plaque

The vitamin K2 story, though still preliminary, is becoming increasingly interesting from the perspective of CT heart score reduction.

The origin of this concept came from some unexpected observations. One, the observation that osteoporosis (lack of bone calcium that leads to fractures) arises from deficiency of vitamin K2. Two, deficiency of K2 leads to unrestrained calcium deposition in animal models, leading to heart attack in just weeks.

Vitamin K2 has been largely ignored for years, since the more widely understood K1 is rarely deficient. K1 deficiency can occur from prolonged antibiotic use, or from severe malnutrition. But deficiency in otherwise well people is very uncommon. Vitamin K2, however, may be a different story. Deficiency may be common.

The Rotterdam Heart Study of cheese-eating Dutch showed that greater K2 intakes resulted in a halving of heart attacks. Cheese (traditional varieties, not Velveeta or other make-believe cheese products) is a modest source of K2, as is the Japanese native food, natto. (If you've ever seen natto, I dare you to eat it. I have a pretty strong stomach and curiousity for food, but natto is the one thing I could not eat--it is truly horrible.)

The weight of evidence suggests that vitamin K2 supplementation may prove to be a useful addition to your coronary plaque control program. Clearly, more data are needed, particulary therapeutic obserations, i.e., observing people who take dose X of a K2 prepartion and tracking some feedback measure, e.g., bone density, CT heart scan score, "events" like heart attack, etc.

Nonetheless, the K2 story is clearly worth reading about, perhaps even considering supplementation. Please watch for the Special Report on the www.cureality.com website in the coming days.

Exercise and blood pressure

The media has gotten a hold of a case report from the University of Maryland describing a 51-year old physician who, despite being a long distance runner, had a high heart scan score.

An example of the report can be found at

Heart Disease In A Marathon Runner: Is Too Much Exercise A Bad Thing?

http://www.sciencedaily.com/releases/2007/03/070315091100.htm in Science Daily.


"The mystery was all the more intriguing because his resting blood pressure and fasting cholesterol levels, the usual measures of cardiovascular health, were in the normal range."


When this man was put on a treadmill for a stress test, his blood pressure skyrocketed from a normal 118/78 to 230/78--extremely high, even for exercise. The physicians reporting the case raised the question of whether long-distance running represents a risk for heart disease and if the high blood pressure with exercise is a contributor or cause of the high heart scan score.

These are phenomena we are very familiar with. We have stressed the importance of exercise blood pressure as a trigger for coronary plaque for years. While 230/78 is clearly too high, we find that any blood pressure over 170/80 with exercise adds to the fire and can trigger plaque growth.

However, I think it is absurd to suggest that marathon running itself is a trigger of coronary plaque. I think it is far more likely that the person described in the report had lipoprotein(a), a potent trigger for both exercise-induced hypertension and high CT heart scan scores in seemingly well people. He likely also suffered from a deficiency of vitamin D deficiency, another contributor. There's no need to indict exercise.

If you are in the Track Your Plaque program, you know that stress tests are of questionable helpfulness for the detection of hidden heart disease. But they are useful for assessment of blood pressure responses during exercise. If BP exceeds 170/80 at 10 mets (a measure of exercise effort achieved by walking 3.4 mph at a 14% grade for 3 minutes), then blood pressure may be a contributor to your heart scan score.

"Fish oil is stupid"

"Fish oil is a waste of time and money. It's stupid. Just stop it."

So a patient of mine was advised by another physician when he complained that he occasionally experienced a fishy aftertaste.

This attitude perplexes me. After all the confirmatory data that support the enormous health benefits of omega-3 fatty acid supplementation, including the 11,000 participant GISSI-Prevenzione Trial, you'd think this attitude would be history. What's a little fish aftertaste when heart attack risk is slashed 28%?

Perhaps the tendency to pooh-pooh fish oil is because it's available as a nutritional supplement. This shouldn't make fish oil appear inconsequential. Far from it.

If you witness the extraordinary power for fish oil to reduce triglycerides, you will be immediately convinced of its effectiveness. The ability of omega-3 fatty acids from fish to eliminate intermediate-density lipoprotein (IDL), the persistent abnormal lipoprotein which signals an inability to clear dietary fats from the blood, can also convince you. More than 90% of people with excessive IDL have it completely eliminated by 4000-6000 mg of fish oil (providing 1200-1800 mg EPA + DHA) per day.

The fact that fish oil is available as a prescription "medication," as well as an over-the-counter supplement, causes some physicians to dismiss the power of the supplemental form. This is nonsense. The over-the-counter form is every bit as effective as the prescription form.

The makers of prescription Omacor also make the claim that their preparation is safer and purer. That may be true, but I'd like to see independent verification from the FDA, USDA, or an unbiased organization like Consumer Reports before I accept their marketing as fact--particularly at $120 to $240 per month! If Omacor proves to contain substantially less mercury and pesticide residues, then that will need to be factored in. (Please note that both Consumer Reports and Consumer Labs measured no substantial mercury or pesticide residues in their analyses of 16 and 41 brands, respectively.)

I try to persuade my colleagues that the idea of taking supplements is a wonderful trend that allows people to express ownership of their own health. What people need is guidance, not salesmanship for a more expensive version, nor dismissal of nutritional preparations that actually possess considerable benefits.

Copyright © 2026 Cureality.com

All posts by william-davis

Wheat "debate" on CBC

"Many Canadians plan warm buns, stuffing and pie for their Thanksgiving meals tonight. But I'll speak with a cardiologist who thinks we have no reason to be thankful for any food that contains wheat. William Davis says our daily bread is making us fat and sick."

That's the introduction to my recent interview and debate on CBC, the Canadian public radio system, aired on the Canadian Thanksgiving. Arguing the other side was Dr. Susan Whiting, an academic nutritionist. (I use the word "arguing" loosely, since she hardly argued the issues, certainly hadn't read the book, but was content to echo the conventional line that whole grains are healthy and cutting out a food group is unhealthy.)

I do have to give credit to the Canadian media, including the CBC, who have been hosting some rough-and-tumble discussions about the entire wheat question despite Canada being a world exporter of wheat. I recently participated in another debate with a PhD nutrition expert from Montreal who, in response to my assertion that the genetically-altered high-yield, semi-dwarf strains have changed the basic composition of wheat, argued that the creation of the 2-foot tall semi-dwarf strain was a convenience created so that farmers could see above their fields--no kidding. I stifled my laugh. (The semi-dwarf variants were actually created to compensate for the heavy seed head that develops with vigorous nitrate fertilization that buckles 4 1/2-foot tall wheat stalk, making harvesting and threshing impossible, a process farmers call "lodging." The 2-foot tall semi-dwarf thick, stocky stalk is strong enough to resist lodging.)

In short, debating the nutrition "experts" on this question has been tantamount to arguing with a school age child on the finer points of quantum physics. There has not yet been any real objection raised on the basic arguments against modern genetically-altered wheat. Modern semi-dwarf wheat is, and remains, an incredibly bad creation of the genetics laboratories of the 1970s. It has no business on the shelves of your grocery store nor on the cupboards in your home.

Carrot Cake

This is among my favorite recipes from the Wheat Belly book. I reproduce it here for those of you who read the Kindle or audio version and therefore didn't get the recipes.

I made this most recently this past weekend. It was gone very quickly, as even the 13-year old gobbled it up.

(I reduced the sour cream in this version from 8 to 6 oz to reduce cooking time. Also, note that anyone trying to avoid dairy can substitute more coconut milk, i.e., the thicker variety, in equivalent quantities.)

Makes 8-10 servings


Ingredients:
Cake:
2 cups carrots, finely grated
1 cup chopped pecans
1 cup coconut flour
1 tablespoon ground flaxseed
2 teaspoons ground cinnamon
1 teaspoon allspice
1 teaspoon nutmeg
1 teaspoon baking powder
2 tablespoons freshly grated orange peel
Sweetener equivalent to ½ cup sugar (e.g., 4 tablespoons Truvia)
½ teaspoon sea salt
4 eggs
1/2 cup butter or coconut oil, melted
2 teaspoons vanilla extract
½ cup coconut milk
6 ounces sour cream

Icing:
8 ounces cream cheese or Neufchâtel cheese, softened
1 teaspoon lemon juice
1 tablespoon Truvía or 1/8 teaspoon stevia extract powder or ¼ cup Splenda

Preheat oven to 325° degrees F. Grate carrots and set aside.

Combine coconut flour, flaxseed, cinnamon, nutmeg, baking powder, orange peel, sweetener, and salt in large bowl and mix by hand.

Put eggs, butter or coconut oil, vanilla coconut milk, and sour cream in mixing bowl; mix by hand. Pour liquid mixture into dry pecan/coconut flour mixture and blend with power mixer until thoroughly mixed. Stir carrots and pecans in by hand with spoon. Pour mixture into greased 9- or 10-inch square cake pan.

Bake for 60 minutes or until toothpick withdraws dry. Allow to cool 30 minutes.

Place Neufchâtel cheese in bowl. Add lemon juice and sweetener and mix thoroughly. Spread on cake.

Why wheat makes you fat

How is it that a blueberry muffin or onion bagel can trigger weight gain? Why do people who exercise, soccer Moms, and other everyday people who cut their fat and eat more "healthy whole grains" get fatter and fatter? And why weight gain specifically in the abdomen, the deep visceral fat that I call a "wheat belly"?

There are several fairly straightforward ways that wheat in all its varied forms--whole wheat bread, white bread, multigrain bread, sprouted bread, sourdough bread, pasta, noodles, bagels, ciabatta, pizza, etc. etc.--lead to substantial weight gain:

High glucose and high insulin--This effect is not unique to wheat, but shared with other high-glycemic index foods (yes: whole wheat has a very high-glycemic index) like cornstarch and rice starch (yes, the stuff used to make gluten-free foods). The high-glycemic index means high blood glucose triggers high blood insulin. This occurs in 90- to 120-minute cycles. The high insulin that inevitably accompanies high blood sugar, over time and occurring repeatedly, induces insulin resistance in the tissues of the body. Insulin resistance causes fat accumulation, specifically in abdominal visceral fat, as well as diabetes and pre-diabetes. The more visceral fat you accumulate, the worse insulin resistance becomes; thus the vicious cycle ensues.

Cycles of satiety and hunger--The 90- to 120-minute glucose/insulin cycle is concluded with a precipitous drop in blood sugar. This is the foggy, irritable, hungry hypoglycemia that occurs 2 hours after your breakfast cereal or English muffin. The hypoglyemia is remedied with another dose of carbohydrate, starting the cycle over again . . . and again, and again, and again.

Gliadin proteins--The gliadin proteins unique to wheat, now increased in quantity and altered in amino acid structure from their non-genetically-altered predecessors, act as appetite stimulants. This is because gliadins are degraded to exorphins, morphine-like polypeptides that enter the brain. Exorphins can be blocked by opiate-blocking drugs like naltrexone. A drug company has filed an application with the FDA for a weight loss indication for naltrexone based on their clinical studies demonstrating 22 pounds weight loss after 6 months treatment. Overweight people given an opiate blocker reduce calorie intake 400 calories per day. But why? There's only one food that yields substantial quantities of opiate-like compounds in the bloodstream and brain: wheat gliadin.

Leptin resistance--Though the data are preliminary, the lectin in wheat, wheat germ agglutinin, has the potential to block the leptin receptor. Leptin resistance is increasingly looking like a fundamental reason why people struggle to lose weight. This might explain why eliminating, say, 500 calories of wheat consumption per day yields 3500 calories of weight loss.

And, as in many things wheat, the whole is greater than the sum of the parts. Despite all we know about this re-engineered thing called wheat, eliminating it yields health benefits, including weight loss, that seem to be larger than what you'd predict with knowledge of all its nasty little individual pieces.

Just who is "Real Facts 2000"?

This is an example of what seems to be developing over at Amazon.com, posted as a "book review":

The author has no credentials, no credibility, just a small cult of terribly misinformed followers. Don't be fooled by the high volume screech against wheat and grains. Allegations of "secret ingredients in wheat" to make you eat more, or comparisons to cigerettes. Seriously?! For over 8000 years wheat has sustained and grown human kind, oh and it tastes good when mixed with a little water and yeast. Every nutritionist and serious medical professional will tell you that bread is the most economical and safe source of essential nutrients. In fact, bread is handed out in natural disasters because it sustains life without food safety issues or requiring refrigeration. And now, suddenly it will kill you. Comical! This book is such a bone headed, misinformed way to just scare people into not eating.

As for secret ingredients, humm, apparently the author is ignorant of the food laws that regulate everything that goes into food and on food labels. Unlike some enforcement agencies, the FDA has some serious teeth behind its enforcement. As for frankenwheat, again seriously?! Wheat, due to its ubiquitous presence in the world is treated as sacrosant from any GMO research or development.

If you need real, science based information on healthy eating, check out [...] and leave this book and its cult in the compound.


If you recognize the wording and tone, you will readily recognize the footprints of the Wheat Lobby here. "Terribly misinformed followers"? . . . Hmmm. "Food laws"? I didn't realize that eating more "healthy whole grains" was a . . . law?

Make no mistake: There are people and organizations who have a heavy stake in your continued consumption of the equivalent of 300 loaves of bread per year. There are people and organizations (read: pharmaceutical industry) who have a big stake on the "payoff" of your continued consumption of "healthy whole grains."

This is not a book review; this is part of a concerted, organized campaign to discredit a message that needs to be heard.

Anybody from the media listening?

Almonds are the new wheat

Once you eliminate this genetically-altered Frankengrain called modern wheat, the diet should center around vegetables, nuts, healthy oils like olive and coconut, fish, meats, cheese, olives, avocados and other real whole foods. This is, in fact, the diet that I have advocated in my heart disease prevention practice, as well as my online program for prevention and reversal of heart disease.

But what if you'd like a piece of cheesecake or a nice slice of dessert bread---but you don't want to gain two pounds, spend 48 hours in the bathroom suffering with diarrhea and cramps, 3 weeks of joint pains and leg swelling, wade through mental "fog," anxiety, and rage just because you had that momentary indulgence---as you would with wheat?

That's why I've been focusing on recipes that allow you to have something familiar, e.g., chocolate coconut bread or biscotti, but using ingredients that will not generate the metabolic contortions triggered by wheat.

On perusing these recipes, you will notice that there are recurring ingredient themes. Many of the same ingredients pop up time and again. Among the most frequent, versatile, user-friendly, and tasty: Almonds.

You can use almonds as ground whole almonds, ground blanched almonds for a finer texture, ground roasted almonds, almond butter (though, for maximum health benefits, I prefer the ground whole almonds). Ground almonds allow you to recreate muffins, breads, scones, pizza crust, pie crust, biscotti, and cookies with health benefits that exceed that of whole wheat---but with none of the downside: no weight gain, no high blood sugar, no triggering of small LDL particles (#1 cause of heart disease in the U.S.), no accumulation of visceral fat, no appetite stimulation.

In short, you just have your chocolate almond biscotti or mocha cupcake and enjoy it, no health price to pay. So I call almonds the new wheat, except better.

Being regular is dangerous to your health

No, I'm not referring to your daily morning ritual in the bathroom. I'm talking about heart rate.

Counterintuitively, a perfectly regular heart rate is a marker of poor health. People with perfect regularity of heart rate have more heart attacks, for instance.

Regularity of heart rate occurs more commonly in people with hypertension and other metabolic derangements, and it signals increased risk for both heart attack and death. A perfectly regular heart rate, i.e., no variation in the time interval from beat to beat, suggests that the parasympathetic nervous system, the component of automatic ("autonomic") nervous system control that is associated with the relaxation response, feelings of well-being, quiet, and relaxation, is weak. It also means that the opposing sympathetic nervous sytem that regulates the "fight or flight," adrenaline-like response is allowed to be dominant. Dominance of the sympathetic over the parasympathetic system generates regularity of heart rate. Heart rate also tends to be faster, e.g., 85 beats per minutes rather than 55 or 60 beats per minute. So perfect regularity, as well as increased rate, is undesirable.

What we want is irregularity of heart rate. But not irregularity that occurs chaotically with no rhyme or reason. More precisely, we want variability in heart rate. And we want variability to occur in synchrony with breathing, i.e., the respiratory cycle.

The ideal response is:

1) increase in heart rate with inspiration

2) decrease in heart rate with expiration.

Heart rate in healthy people typically varies 15-20 beats per minute within the respiratory cycle, e.g., 60 bpm at end-exhalation, 80 bpm at end-inspiration.

Restoration of increased heart rate variability is associated with reduced blood pressure, reduced blood sugars (HbA1c), reduced inflammatory markers and cortisol (associated with stress), even an increase in DHEA levels. Feelings of well-being and calm also develop.

Among the strategies to consider to restore heightened heart rate variability and slowed heart rate include:

--Omega-3 fatty acid supplementation
--Exercise
--Weight loss
--Deep breathing exercises
--Meditation, prayer, and biofeedback

For our Track Your Plaque purposes, we are folding in the HeartMath strategies, i.e., use of a heart rate monitor that calculates heart rate variability in the context of respiratory cycle. If you've not already done so, take a look at the two Special Reports devoted to this topic on the Track Your Plaque website.

You mean weight loss is hazardous to your health?

In my last Heart Scan Blog post, What is this wacky thing called weight loss?, I discussed how weight loss is associated with distortions in cholesterol and blood sugar values that can be very confusing, often leading your doctor to wrongly and unnecessarily prescribe drugs--since he/she likely rarely sees weight loss.

Blog reader, Donald K., posted his enlightening story:

I experienced this very thing.

After losing serious weight from the eliminating wheat, processed, and sugary foods (1 year in total) I lost 130 pounds. When I was nearly finished I went to see my doctor. He wanted to put me on statins. I explained to him how the data does not support application to me (no evidence of heart disease) and I got the mantra about standards of practice, etc, etc. I held my ground and decided I am much happier eating dairy, eggs, grass fed beef, wild caught fish, and as much raw foods (nuts, veggies, fruits) as my body desires to treat my health parameters.

Maintaining weight, it is easy. My BMI (23 down from 40) has remained constant for a few months now. You are right: metabolic processes definitely change. I no longer have sensations of glucose fluctuations or an uncontrolled appetite. I can only imagine the improved hormone regulation and metabolic communication going on inside my body.

The symptoms from obesity, all gone. Goodbye sleep apnea, hypertension, hemorrhoids, arrhythmias, gastroinestinal disruptions, smelly body, chaffing thighs, and others not mentioned. The positive effects are just as dramatic, but I don’t want to ramble on.

Weight loss? What is it? Getting your life back!


Brace yourself: If you are following the nutrition advice posted here and in the Track Your Plaque program, or the discussion I've initiated in Wheat Belly, then you may find yourself in the very same health predicament as Donald. Arm yourself to protect yourself against the drug-wielding ways of doctors. No, weight loss to achieve ideal weight is definitely not bad for health. But your doctor's misinterpretation of its effects can be!

What is this wacky thing called "weight loss"?

I've discussed this before, but it has proven such an (encouragingly!) frequent issue that I thought it was worth discussing once again.

What happens when you lose weight?

The process of weight loss is characterized by multiple shifts in metabolic patterns that can be confusing. To the uninitiated eye, weight loss can look like a disastrous distortion in metabolism. The naive doctor on seeing your lab values, for instance, might insist you take a statin drug, a fibrate like Tricor (to reduce triglycerides or increase HDL), or simply berate you for your bad health habits--when it's actually a good thing you've accomplished.

So when you lose weight, say, 30 pounds in 3 months, what have you accomplished?

Energy stored as fat, especially from visceral fat stores, is mobilized into the bloodstream. It floods the bloodstream as fatty acids and triglycerides. These fatty acids and triglycerides don't occur in isolation, but interact with other particles and metabolic patterns. The resulting blood patterns include:

--Increased triglycerides--An increase in triglycerides, for instance, from 90 mg/dl to 200 mg/dl in the midst of weight loss is common.

--Reduced HDL--The flood of triglycerides leads to increased degradation of HDL, thus a drop. A drop in HDL from, say, 40 mg/dl to 27 mg/dl--very frightening to people--is exceptionally common.

--Increased blood sugar--The flood of fatty acids and triglycerides results in insulin resistance, leading to higher blood sugars. It is not uncommon for someone with pre-diabetes to develop diabetic-range blood sugars, or a non-diabetic to show pre-diabetic blood sugars.

--Increased small LDL particles--Though small LDL is highly variable during weight loss. When it does happen, it's probably from the interaction of VLDL (triglycerides) with LDL particles and the reaction that overloads LDL particles with triglycerides and conversion to small LDL particles.

So why don't doctors often recognize these patterns when a patient loses weight? Because they rarely see it. Most of my colleagues are accustomed to having patients come back with weight gain, getting heavier and heavier each time. Lose weight? Impossible! So they just don't recognize weight loss effects when they see it. As followers of The Heart Scan Blog know, a frequent conversation around here is "Am I too skinny?" or "How do I stop losing weight?"

The solution: Be patient. Be patient and wait about two months after a weight plateau has been achieved. That's when the numbers "settle down" and you see marked drops in triglycerides, increases in HDL, drops in blood sugar, reductions in small LDL.

As with many things, it's all about timing.

Why small LDL particles are the #1 cause of heart disease in the US

Ask your doctor: What is the #1 cause of heart disease in the US?

Let's put aside smoking, since it is an eminently modifiable risk and none of those crazies read this blog anyway. What will your doctor say? Most like he or she will respond:

High cholesterol or high LDL cholesterol

Too much saturated fat

Obesity

Pfizer, Merck, AstraZeneca and their kind would be overjoyed to know that they can add your doctor to their eager following.

I'd tell you something different. I would tell you that small LDL particles are, by far and away, the #1 cause for heart disease. I base this claim on several observations:

--Having run over 10,000 lipoprotein panels (mostly NMR) over the past 15 years, it is a rare person who does not have a moderate, if not severe, excess of small LDL particles. 50%, 70%, even 90% or more small LDL particles are not rare. Over the course of a year, the only people who show no small LDL particles are slender, athletic, pre-menopausal females.

--In studies in which lipoproteins have been quantified in people with coronary disease, small LDL particles dominate, just as they do in my office. Here's a 2006 review.

--Small LDL is largely the province of people who consume carbohydrates, such as the American population instructed to "cut fat and eat more healthy whole grains." Conventional diet advice has therefore triggered an expllosion in small LDL particles.

--When fasting triglycerides exceed 60 mg/dl, small LDL particles increase as a proportion of total LDL particles. This includes the majority of the US population. (This ignores postprandial, or after-eating, triglycerides, which also contribute to small LDL formation.)

If you were to read the data, however, you might conclude that small LDL affects a minority of people. This is because in most studies small LDL categorize it as either "pattern B," meaning exceeding some arbitrary threshold of percentage of small LDL particles, versus "pattern A," meaning falling below that same arbitrary threshold.

Problem: There is no consensus on what percentage of small LDL particles should mark the cutoff between pattern A vs. pattern B. In many studies, for instance, people with 50% small LDL particles are called "pattern A."

If, instead, we were to set the bar lower to identify this highly atherogenic (atherosclerotic plaque-causing) particle at, say, 20-30% of total, then the number or percentage of people with "pattern B" small LDL particles would go much higher.

I see this play out in my office and in the online program, Track Your Plaque, every day: At the start eating a low-fat, grain-filled diet with lots of visceral fat ("wheat belly") to start, they add back fat and cut out all wheat and limit carbohydrates. Small LDL particles plummet

Even moore from Jimmy Moore

The ubiquitous and irrepressible Jimmy Moore posted even more commentary about the Wheat Belly phenomenon here, what he calls "The Wheat Belly Bonanza."

Is low-carb really, at its core, little more than elimination of wheat? Sure, corn, rice, and sugar exert deleterious effects. But the dominant effect--by far--is the elimination of wheat. So is the low-carb movement really, at its core, a wheat-elimination movement?

Food (non-wheat-containing, of course) for thought.

Copyright © 2026 Cureality.com

You just THINK you're low-carb

Systematically checking postprandial (after-eating) blood sugars is providing some great insights into crafting a better diet for many people.

I last discussed the concept of postprandial glucose checks in To get low-carb right, you need to check blood sugars.

Here are some important lessons that many people--NON-diabetic people, most with normal blood glucoses or just mildly increased--are learning:

Oatmeal yields high blood sugars. Even if your fasting blood sugar is 90 mg/dl, a bowl of oatmeal with skim milk, walnuts, and some berries will yield blood sugars of 150-200 mg/dl in many people.

Cheerios yields shocking blood sugars. 200+ mg/dl is not uncommon in non-diabetics. (Diabetics have 250-350 mg/dl.)

Fruits like apples and bananas increase blood sugar to 130 mg/dl or higher.

Odd symptoms, such as mental "fog," fatigue, and a fullness in the head, are often attributable to high blood sugars.

A subset of people with lipoprotein(a) can have wildly increased blood sugars despite their slender build and high aerobic exercise habits.


Once you identify the high blood sugar problem, you can do something about it. The best place to start is to reduce or eliminate the sugar-provoking food.

The LDL-Fructose Disconnect

All posts by william-davis

Fish oil: What's the difference?

Ultra-purified, pharmaceutical grade, molecularly distilled. Over-the-counter vs. prescription. Gelcap, liquid, emulsion.

There's a mind-boggling variety of choices in fish oil today. A visit to any health food store, or any "big box" store for that matter, will yield at least several, if not dozens, of choices, all with varying and often extravagant claims of purity and potency.

So what's the real story?

Given the analyses conducted over the years, along with my experience with dozens of different preparations, I believe that several conclusions can be reached about fish oil:

Fish oil is free of contamination with mercury, dioxin, PCBs, or furans. To my knowledge, only one fish oil preparation has been found to have a slight excess of PCBs. (This is different from cod liver oil that has been found by one source to have a slight excess of PCBs.)

Oxidative breakdown products differ among the various brands. Consumer Lab (http://www.consumerlab.org/), for instance, has found that several widely available brands of fish oil contained excessive oxidative breakdown products (TOTOX). You can perform you own simple test of oxidative breakdown products: Sniff it. Your fish oil should pass the "sniff test." High quality fish oil should smell non-fishy to lightly fishy. Rancid fish oil with excessive quantities of oxidative breakdown products will smell nasty fishy.

FDA approval does not necessarily mean greater potency, purity, or effectiveness. It just means that somebody assembled the hundreds of millions of dollars to obtain FDA approval, followed by lots of marketing savvy to squash the competition.

This means that there are a number of excellent fish oil products available. My favorites are the liquid fish oils from Pharmax, Nordic Naturals, and Barleans. Capsules from Carlson, PharmaNutrients, and Fisol have also performed consistently. The "big box" capsules from Sam's Club and Costco have also performed well and are wonderfully affordable.

Wheat-free pie crust

I've been working on wheat-free yet healthy recipes these past two months.

You can buy wheat-free, gluten-free foods at the store, of course. But the majority of these products are unhealthy because cornstarch, rice starch, potato starch, or tapioca starch are commonly used in place of wheat. Recall that these are among the few foods that increase blood glucose higher than even wheat.

Here's a simple recipe for wheat-free pie crust that works best for cheesecake, pumpkin pie, and cream pies, but not for berry or other fruit pies like apple.

You will need:
?
1½ cups ground pecans
6 tablespoons melted butter?or melted coconut oil
1 teaspoon vanilla extract?
2 teaspoons cinnamon
1 medium egg
2 tablespoons Truvia™ or ½ teaspoon stevia extract or ½ cup Splenda®

Mix all ingredients thoroughly in bowl. Pour mixture into pie pan and press onto bottom and sides.

Fill pie crust with desired filling. You can fill it with your favorite cheesecake recipe (e.g., Neufchatel or cream cheese, sour cream, eggs, vanilla, and stevia; add pumpkin for pumpkin cheesecake) and bake, usually at 350 degrees F for one hour. 

Yes, the butter provokes insulin and artificial sweeteners can trigger appetite. But, for the holidays, a slice or two of pie made with this crust will not increase blood sugar nor trigger the uncontrolled impulse eating that wheat crust will trigger.

Have a cookie

Here's a great insight dating all the way back to 1966 from one of the early explorations in lipoproteins from the National Institutes of Health lab of Levy, Lees, and Fredrickson:

The nature of pre-beta (very low density) lipoproteins

The subject is a 19 year old female (among the total of 11 in the this small, diet-controlled study) who was first fed a low-carbohydrate (50 grams per day), low-cholesterol diet; followed by a high-carbohydrate (500 grams per day), low-fat (5 grams per day) diet.


To B or not to B

Apoprotein B (apo B) is the principle protein that resides in LDL particles along with other proteins, phospholipids, triglycerides, and, of course, cholesterol.

There's a curious thing about apo B. Just like one child per family in China or one television per household in 1950s America, there is only one apo B for every LDL particle.

So measuring apo B, in effect, provides a virtual count of LDL particles. (Actually, VLDL particles, the first lipoprotein to emerge from the liver, also have one apo B per particle but LDL particles far outnumber VLDL particles.) While apo B structure can show limited structural variation from individual to individual, the effect on measured apo B is negligible.

One apo B per LDL particle . . . no more, no less. What about the other components of LDL particles?

The other components of LDL particles are a different story. Cholesterol and triglycerides in LDL particles vary substantially. Diet has profound effects on cholesterol and triglyceride content of LDL particles. A diet rich in carbohydrates, for instance, increases triglycerides in LDL particles while reducing cholesterol. This means that measuring cholesterol in the LDL fraction will be misleading, since cholesterol will be falsely low. LDL cholesterol is therefore a flawed means to assess the behavior and composition of LDL particles. In particular, when LDL particles become enriched in triglycerides, they go through a process that transforms them into small LDL particles, the variety most likely to cause atherosclerosis.

In other words, when the worst situation of all--an abnormal abundance of small LDL particles develops--it is usually not signalled by high LDL cholesterol.

Because apo B is not sensitive to the composition of LDL particles--high cholesterol, low cholesterol, high triglycerides, etc.--it is a superior method to characterize LDL particles. While apo B doesn't tell you whether LDL particles are big, small, or in between, it provides a count of particles that is far more helpful than measuring this deeply flawed thing called "LDL cholesterol."

(Even better: Count LDL particles and measure LDL size, since size gives us insight into sensitivity to oxidation, glycation, adhesiveness, ability to trigger inflammatory pathways via monocyte chemoattractant protein, various interleukins, tunor necrosis factor and others. This is why cholesterol panels should go the way of tie dye shirts and 8-track tapes: They are hopelessly, miserably, and irretrievably inaccurate. Cholesterol panels should be replaced by either apoprotein B or lipoprotein measures.)

Put lipstick on a dwarf

Today, virtually all wheat products are produced from the Triticum aestivum dwarf mutant.

You might call it "multi-grain bread,""oat bread," or "flaxseed bread." You could call it "organic," "pesticide-free," "non-GMO," or "no preservatives." It might be shaped into a ciabatta, bruschetta, focaccia, or panini. It might be sourdough, unleavened, or sprouted. It could be brown, black, Pumpernickel, or white. It could be shaped into a roll, bun, bagel, pizza, loaf, pretzel, cracker, pancake, brioche, baguette, or pita. It could be matzah, challah, naan, or Communion wafers.

No matter what you call it, it's all the same. It's all from the dwarf mutant Triticum aestivum plant, the 18-inch tall product of hybridizations, backcrossings, and introgressions that emerged from genetics research during the 1960s and 70s.

According to Dr. Allan Fritz, Professor of Wheat Breeding at Kansas State University, and Dr. Gary Vocke at the USDA, over 99% of all wheat grown today is the dwarf variant of Triticum aestivum. (For you genetics types, Triticum aestivum is the hexaploid, i.e., 3 combined genomes, product of extensive hybridizations, while ancestral einkorn is a diploid, i.e., a single genome, grass. Hexaploid Triticum aestivum contains the especially hazardous "D" genome, the set of genes most commonly the recipient of genetic manipulations to modify the characteristics of flour, such as gluten content. Einkorn contains only the original "A" genome.)

No matter what you call it, add to it, how you shape it, etc., it's all the same. It's all the dwarf mutant product of tens of thousands of hybridizations.

You can put lipstick on a pig, but it's still a pig. By the way, lipstick may contain wheat.

What the Institute of Medicine SHOULD have said

The news is full of comments, along with many attention-grabbing headlines, about the announcement from the Institute of Medicine that the new Recommended Daily Allowance (RDA) for vitamin D should be 600 units per day for adults.

What surprised me was the certainty with which some of the more outspoken committee members expressed with their view that 1) the desirable serum 25-hydroxy vitamin D level was only 20 ng/ml, and 2) that most Americans already obtain a sufficient quantity of vitamin D.

Here's what I believe the Institute of Medicine SHOULD have said:

Multiple lines of evidence suggest that there is a plausible biological basis for vitamin D's effects on cancer, inflammatory responses, bone health, and metabolic responses including insulin responsiveness and blood glucose. However, the full extent and magnitude of these responses has not yet been fully characterized.

Given the substantial observations reported in several large epidemiologic studies that show an inverse correlation between 25-hydroxy vitamin D levels and mortality, there is without question an association between vitamin D and mortality from cancer, cardiovascular disease, and all cause mortality. However, it has not been established that there are cause-effect relationships, as this cannot be established by epidemiologic study.

While the adverse health effects of 25-hydroxy vitamin D levels of less than 30 ng/ml have been established, the evidence supporting achieving higher 25-hydroxy vitamin D levels remains insufficient, limited to epidemiologic observations on cancer incidence. However, should 25-hydroxy vitamin D levels of greater than 30 ng/ml be shown to be desirable for ideal health, then vitamin D deficiency has potential to be the most widespread deficiency of the modern age.

Given the potential for vitamin D's impact on multiple facets of health, as suggested by preliminary epidemiologic and basic science data, we suggest that future research efforts be focused on establishing 1) the ideal level of 25-hydroxy vitamin D levels to achieve cancer-preventing, bone health-preserving or reversing, and cardiovascular health preventive benefits, 2) the racial and genetic (vitamin D receptor, VDR) variants that may account for varying effects in different populations, 3) whether vitamin D restoration has potential to exert not just health-preserving effects, but also treatment effects, specifically as adjunct to conventional cancer and osteoporosis therapies, and 4) how such vitamin D restoration is best achieved.

Until the above crucial issues are clarified, we advise Americans that vitamin D is a necessary and important nutrient for multiple facets of health but, given current evidence, are unable to specify a level of vitamin D intake that is likely to be safe, effective, and fully beneficial for all Americans.


Instead of a careful, science-minded conclusion that meets the painfully conservative demands of crafting broad public policy, the committee instead chose to dogmatically pull the discussion back to the 1990s, ignoring the flood of compelling evidence that suggests that vitamin D is among the most important public health issues of the age.

Believe it or not, this new, though anemic, RDA represents progress: It's a (small) step farther down the road towards broader recognition and acceptance that higher intakes (or skin exposures) to achieve higher vitamin D levels are good for health.

My view: Vitamin D remains among the most substantial, life-changing health issues of our age. Having restored 25-hydroxy vitamin D levels in over 1000 people, I have no doubt whatsoever that vitamin D achieves substantial benefits in health with virtually no downside, provided 25-hydroxy vitamin D levels are monitored.

Coronary calcium: Cause or effect?

Here's an interesting observation made by a British research group.

We all know that coronary calcium, as measured by CT heart scans, are a surrogate measure of atherosclerotic plaque "burden," i.e., an indirect yardstick for coronary plaque. The greater the quantity of coronary calcium, the higher the heart scan "score," the greater the risk for heart attack and other unstable coronary syndromes that lead to stents, bypass, etc.

But can calcium also cause plaque to form or trigger processes that lead to plaque formation and/or instability?

Nadra et al show, in an in vitro preparation, that calcium phosphate crystals are actively incorporated into inflammatory macrophages, which then trigger a constellation of inflammatory cytokine release (tumor necrosis factor-alpha, interleukins), fundamental processes underlying atherosclerotic plaque formation and inflammation.

Here's the abstract of the study:
Proinflammatory Activation of Macrophages by Basic Calcium Phosphate Crystals via Protein Kinase C and MAP Kinase Pathways:

A Vicious Cycle of Inflammation and Arterial Calcification?


Basic calcium phosphate (BCP) crystal deposition underlies the development of arterial calcification. Inflammatory macrophagescolocalize with BCP deposits in developing atherosclerotic lesionsand in vitro can promote calcification through the release of TNF alpha. Here we have investigated whether BCP crystals can elicit a proinflammatory response from monocyte-macrophages.BCP microcrystals were internalized into vacuoles of human monocyte-derived macrophages in vitro. This was associated with secretion of proinflammatory cytokines (TNF{alpha}, IL-1ß and IL-8) capable of activating cultured endothelial cells and promoting capture of flowing leukocytes under shear flow. Critical roles for PKC, ERK1/2, JNK, but not p38 intracellular signaling pathways were identified in the secretion of TNF alpha, with activation of ERK1/2 but not JNK being dependent on upstream activation of PKC. Using confocal microscopy and adenoviral transfection approaches, we determined a specific role for the PKC-alpha isozyme.

The response of macrophages to BCP crystals suggests that pathological calcification is not merely a passive consequence of chronic inflammatory disease but may lead to a positive feed-back loop of calcification and inflammation driving disease progression.


This observation adds support to the notion that increasing coronary calcium scores, i.e., increasing accumulation of calcium within plaque, suggests active plaque. As I say in Track Your Plaque, "growing plaque is active plaque." Active plaque means plaque that is actively growing, inflamed and infiltrated by inflammatory cells like macrophages, eroding its structural components, and prone to "rupture," i.e., cause heart attack. Someone whose first heart scan score is, say, 100, followed by another heart scan score two years later of 200 is exposed to sharply increasing risk for cardiovascular events which may, in part, be due to the plaque-stimulating effects of calcium.

Conversely, reducing coronary calcium scores removes a component of plaque that would otherwise fuel its growth. So, people like our Freddie, who reduced his heart scan score by 75%, can be expected to enjoy a dramatic reduction of risk for cardiovascular events.

Less calcium, less plaque to rupture, less risk.

Wheat one-liners

If you're having difficulty convincing a loved one or someone else that wheat should be eliminated from the human diet, here are some useful one-liners to use:

Wheat makes your boobs big.
(This is true. Priceless for women to use on their husbands.)

Wheat causes dementia.
(And confirmed on examination of brain tissue at autopsy. Yes, autopsy.)

Wheat makes you look pregnant.
(The visceral fat of a wheat belly does a darn good imitation of a near-term infant.)

The first sign of wheat intolerance can be wetting your pants.
(Cerebellar ataxia, i.e., destruction and atrophy of the cerebellum, caused by wheat leads to loss of coordination and bladder control. Average age of onset: 53 years old.)

White flour bad, whole grain better; just as Marlboros are bad, Salems are better.
(The flawed syllogism that led to the "eat more healthy whole grain" colossal blunder.)

Wheat is the only food with its very own mortality rate.
(Celiac disease, osteoporotic hip fractures, and the neurologic diseases triggered by wheat can be fatal.)

"Wheat" is no longer wheat; it's the dwarf mutant that came from genetics research in the 1960s.
(Over 99% of all wheat today comes from the 18-inch tall dwarf mutant.)

Wheat increases blood sugar higher than nearly all other foods.
(Higher than Milky Way bars, higher than Snickers bars, higher than table sugar.)


There you have it: A full arsenal of one-liners to shoot at your husband, wife, or friend when they roll their eyes at your refusal to consume this thing called "wheat."

The happy homeotherm

If you were a "cold blooded" poikilotherm unable to regulate internal body temperature, you would have to sun yourself on rocks to raise your body temperature, just like turtles and snakes. When it got cold, your metabolic rate would slow and you might burrow into the mud to hide.

You and I, however, are homeotherms, terrestrial animals able to regulate our own internal body temperature. Principal responsibility for keeping your body temperature regulated falls with the thyroid gland, your very own thermoregulatory "thermostat."

But internal body temperature, even in a homeotherm, varies with circadian rhythm: Highest temperature occurs in the early evening around 8 p.m.; the low temperature nadir occurs at around 4 a.m.

The notion that normal human temperature is 98.6 degrees Fahrenheit is a widely-held fiction, a legacy of the extraordinary experience of 19th century German physician, Carl Reinhold August Wunderlich, who claims to have measured temperatures of one million people using his crude, uncalibrated thermometer to obtain axillary (armpit) body temperatures.

Dr. Broda Barnes was a 20th century American proponent of using the nadir body temperature to gauge thyroid function. Like Wunderlich, Barnes also used axillary temperatures.

Modern temperature assessments have employed radiotransmitting thermistors that are swallowed, with temperatures tracked as the thermistor travels through the stomach, duodenum, small intestine, large intestine, rectum, then peek-a-boos back out. Such internal "core temperature" assessments have shown that:

--Axillary temperatures do not track with internal core temperatures very well, often veering off course due to external factors.
--Axillary temperatures are subject to ambient temperatures, such as room temperature, and are affected by clothing.
--Axillary temperatures are more susceptible to physical activity, e.g., increased with exercise or physical work.

Even right vs. left axillary temperatures have been shown to vary up to 2 degrees Fahrenheit.

Studies such as this demonstrate that normal oral temperature upon arising is around 97.2-97.3 degrees Fahrenheit. While we lack data correlating thyroid function with circadian temperature variation, the a.m. nadir does indeed, as Dr. Barnes originally suggested, seem to track thyroid status quite well: lower with hypothyroidism, higher with normal or hyperthyroidism.

I have been using 97.3 degrees F orally as the cutoff for confirming or uncovering thyroid dysfunction, particularly when symptoms or blood tests (TSH, free T3, free T4) are equivocal, a value that has held up well in the majority of cases. I find it helpful when, for instance, someone complains of cold hands and feet and has normal TSH (1.5 mIU/L or less in my view) but low free T3. An a.m. oral temperature of, say, 95.7 degrees F, suggests that there will be a favorable response to T3 supplementation. And it nearly always plays out that way.

Wouldn't it be interesting to know if there was insight into thyroid status provided by also examining the circadian behavior of temperature (e.g., height or timing of the peak)?

Statin buster?

Merck recently reported preliminary results with its drug-in-development, anacetrapib.

After six months of treatment, participants showed:

LDL cholesterol was reduced from 81 mg/dl to 45 mg/dl in those taking anacetrapib, and from 82 mg/dl to 77 mg/dl in the placebo group.

HDL increased from 41 mg/dl to 101 mg/dl in the drug group, from 40 mg/dl to 46 mg/dl in those on placebo.

As you'd expect, the usual line-up of my colleagues gushed over the prospects of the drug, salivating over new speaking opportunities, handsomely-paid clinical "research" trials, and plenty of nice trips to exotic locales.

Anacetrapib is a cholesteryl-ester transfer protein inhibitor, or CETP inhibitor, much like its scrapped predecessor, torcetrapib . . . you know, the one that went down in flames in 2006 after 60% excess mortality occurred in people taking the drug compared to placebo. The hopes of many investors and Pfizer executives were dashed with torcetrapib's demise. The data on torcetrapib's lipid effects were as impressive as Merck's anacetrapib.

These drugs block the effects of the CETP enzyme, an enzyme with complex effects. Among CETP's effects: mediating the "heteroexchange" of triglycerides from triglyceride-rich VLDL particles that first emerge from the liver for cholesterol from LDL particles. This CETP-mediated process enriches LDL particles with triglycerides, which then make LDL a target for action by another enzyme, hepatic lipase, that removes triglycerides. This yields a several nanometer smaller LDL particle, now the number one most common cause of heart disease in the U.S., thanks to conventional advice to cut fat intake and increase consumption of "healthy whole grains."

With effects like this, anacetrapib, should it hold up under the scrutiny of FDA-required trials and not show the same mortality-increasing effects of torcetrapib, will be a huge blockbuster for Merck if release goes as scheduled in 2015. It will likely match or exceed sales of any statin drug. Statin drugs have achieved $27 billion annual sales, some of it deserved. Anacetrapib will likely handily match or exceed Lipitor's $12 billion annual revenue.

More than increasing HDL, CETP inhibition is really a strategy to reduce small LDL particles.

As with many drugs, there are natural means to achieve similar effects with none of the side-effects. In this case, similar effects to CETP inhibition, though with no risk of heightened mortality, is . . . elimination of wheat, in addition to an overall limitation of carbohydrate consumption. Not just low-carb, mind you, but wheat elimination on the background of low-carb. For instance, eliminate wheat products and limit daily carbohydrate intake to 50-100 grams per day, depending on your individual carbohydrate sensitivity, and small LDL drops 50-75%. HDL, too, will increase over time, not as vigorously as with a CETP inhibitor, but a healthy 20-30% increase, more with restoration of vitamin D.

Eliminating wheat and adjusting diet to ratchet down carbs is, of course, cheap, non-prescription, and can be self-administerd, criteria that leave the medical world indifferent. But it's a form of "CETP inhibition" that you can employ today with none of the worries of a new drug, especially one that might share effects with an agent with a dangerous track record.

Copyright © 2026 Cureality.com

All posts by william-davis

CIS: Carbohydrate intolerance syndrome

Carbohydrate intolerance comes in many shades and colors, shapes and sizes.

I call all of its varieties the Carbohydrate Intolerance Syndrome, or CIS. (Not to be confused with CSI, or Crime Scene Investigation . . . though, come to think of it, perhaps there are some interesting parallels!)

At its extreme, it is called type II diabetes, in which any carbohydrate generates an extravant increase in blood sugar, followed by the domino effect of increased triglycerides, reduction in HDL, creation of small LDL, heightened inflammation, etc. and eventually to kidney disease, coronary atherosclerosis, neuropathies, etc.

An intermediate form of carbohydrate intolerance is called metabolic syndrome, or pre-diabetes. These people, for the most part, look and act like diabetics, though their reaction to carbohydrate intake is not as bad. Blood sugar, for instance, might be 125 mg/dl fasting, 160 mg/dl after eating. The semi-arbitrary definition of metabolic syndrome includes at least three of the following: HDL <40 mg/dl in men, <50 mg/dl in women; triglycerides 150 mg/dl or greater; BP 135/80 or greater; waist circumference >40 inches in men, >35 inches in women; fasting glucose >100 mg/dl.

This is where the conventional definitions stop: Either you are diabetic or have metabolic syndrome, or you have nothing at all.

Unfortunately, this means that the millions of people with patterns not severe enough to match the standard definition of metabolic syndrome are often neglected.

How about Kevin?

Kevin, a 56 year old financial planner, is 5 ft 7 inches, 180 lbs (BMI 28.2). His basic measures:

HDL 36 mg/dl
Triglycerides 333 mg/dl

BP 132/78
Waist circumference 34 inches
Blood sugar 98 mg/dl

Kevin meets the criteria for metabolic syndrome on only two of the five criteria and therefore does not "qualify" for the diagnosis.

Kevin's basic lipids showed LDL 170 mg/dl, HDL 36 mg/dl, triglycerides 333 mg/dl.

But take a look at his underlying lipoprotein patterns (NMR):

LDL particle number 2231 nmol/L (equivalent to a "true" LDL of 223 mg/dl)
Small LDL 1811 nmol/l
Large HDL 0.0 mg/dl


In other words, small LDL constitutes 81% of all LDL particles (1811/2231), a severe pattern. Large HDL is the healthy, protective fraction and Kevin has none. These are high-risk patterns for heart disease. These, too, are patterns of carbohydrate intolerance.

Foods that trigger small LDL and reduction in healthy, large HDL include sugars, wheat, and cornstarch. Kevin is carbohydrate-intolerant, although he lacks the (fasting) blood sugar aspect of carbohydrate intolerance. But he shows all the underlying lipoprotein and other metabolic phenomena associated with carbohydrate intolerance.

We could also cast all three conditions under the umbrella of "insulin resistance." But I prefer Carbohydrate Intolerance Syndrome, or CIS, since it immediately suggests the basic underlying cause: eating carbohydrates, especially those that trigger rapid and substantial surges in blood sugar.

CIS is the Disease of the Century, judging by the figures (both numbers and humans) we are seeing. It will dominate healthcare in its various forms for many years to come.

The first treatment for the Carbohydrate Intolerance Syndrome? Some would say the TZD class of drugs like Avandia. Others would say a DASH or TLC (American Heart Association) diet. How about liposuction, twice-daily Byetta injections, or even the emerging class of drugs to manipulate leptin and adiponectin? How do "heart healthy" foods like Cheerios and Cocoa Puffs fit into this? (Don't believe me? The American Heart Association says they're heart healthy!)

The first treatment for the Carbohydrate Intolerance Syndrome is elimination of carbohydrates, except those that come from raw nuts and seeds, vegetables, occasional real fruit (not those green fake grapes), wine, and dark chocolates.

Making sense out of lipid changes

Maggie had been doing well on her program, enjoying favorable lipids near our 60-60-60 targets (HDL 60 mg/dl or greater, LDL 60 mg/dl or less, triglycerides 60 mg/dl or less). Last fall, her last set of values were:

Total cholesterol: 149 mg/dl
LDL cholesterol: 67 mg/dl
HDL cholesterol: 73 mg/dl
Triglycerides: 43 mg/dl

The holidays, as with most people, involved a frenzy of indulgent eating: Christmas cookies, cakes, pies, stuffing, potatoes, candies, etc.

Maggie returned to the office 6 pounds heavier with these values:

Total cholesterol: 210 mg/dl
LDL cholesterol: 124 mg/dl
HDL cholesterol: 57 mg/dl
Triglycerides: 144 mg/dl

In other words, holiday indulgences caused an increase in LDL cholesterol, a reduction in HDL, an increase in triglycerides, an increase in total cholesterol.

What happened?

At first glance, many of my colleagues would interpret this as fat indulgence and/or a "need" for statin drug therapy.

Having done thousands of lipoprotein panels, I can tell you that, beneath the surface, the following has occurred:

--Overindulgence in carbohydrates from the goodies triggered triglyceride (actually VLDL) formation in the liver, released into the blood.
--Increased triglycerides and VLDL triggered a boom in conversion of large LDL to small LDL (since triglycerides are required to form small LDL particles) via cholesteryl-ester transfer protein (CETP) activity.
--Increased triglycerides and VLDL interacted with HDL particles, causing "remodeling" of HDL particles to the less desirable, less protective small particles, which do not persist as long in the blood, resulting in a reduction of HDL.

The critical factor is carbohydrate intake. This triggered a domino effect that is often misintepreted as excessive fat intake or a genetic predisposition. It is nothing of the kind.

I discussed this phenomenon with Maggie. She now knows to not overindulge in the holiday snacks in future and will revert promptly back to her 60-60-60 values.

How to Give Yourself Hashimoto's Thyroiditis: 101

I borrowed this from the enormously clever Dr. BG at The Animal Pharm Blog.


How to Give Yourself Hashimoto's Thyroiditis: 101

--lack of sunlight/vitamin D/indoor habitation
--mental stress
--more mental stress
--sleep deprivation... (excessive mochas/lattes at Berkeley cafes)
--excessive 'social' calendar
--inherent family history of autoimmune disorders (who doesn't??)
--wheat, wheat, and more wheat ingestion ('comfort foods' craved in times of high cortisol/stress, right? how did I know the carbs were killing me?)
--lack of nutritious food containing EPA DHA, vitamin A, sat fats, minerals, iodine, etc
--lack of play, exercise, movement (or ?overtraining perhaps for Oprah's case)
--weight gain -- which begins an endless self-perpetuating vicous cycle of all the above (Is it stressful to balloon out for no apparent reason? YES)


If you haven't done so already, take a look at Animal Pharm you will get a real kick out of Dr. BG's quick-witted take on things.


We are systematically looking for low thyroid (hypothyroidism) in everyone and findings oodles of it, far more than I ever expected.

Much of the low thyroid phenomena is due to active or previous Hashimoto's thyroiditis, the inflammatory process that exerts destructive effects on the delicate thyroid gland. It is presently unclear how much is due to iodine deficiency in this area, though iodine supplementation by itself (i.e., without thyroid hormone replacement) has not been yielding improved thyroid measures.

I find this bothersome: Is low thyroid function the consequence of direct thyroid toxins (flame retardants like polybrominated diphenyl ethers, pesticide residues in vegetables and fruits, bisphenol A from polycarbonate plastics) or indirect toxins such as wheat via an autoimmune process (similar to that seen in celiac disease)?

I don't know, but we've got to deal with the thyroid-destructive aftermath: Look for thyroid dysfunction, even in those without symptoms, and correct it. This has become a basic tenet of the Track Your Plaque approach for intensive reduction of coronary risk.

Framing

Heart health without a 12" incision


Heart health for less than $44,483 (Cost of a coronary stent according to the American Heart Association 2008 Update)


Track Your Plaque: A drug-free zone


Why an RDA for vitamin D?

The Food and Nutrition Board (FNB) of the Institute of Medicine is charged with setting the values for the Recommended Daily Allowances of various essential nutrients. However, when it comes to vitamin D, the FNB decided that "evidence is insufficient to develop an RDA and [an Adequate Intake, AI] is set at a level assumed to ensure nutritional adequacy."

The National Institutes of Health Office of Dietary Supplements lists the AI's for various groups of people:

14-18 years
Male 200 IU
Female 200 IU

19-50 years
Male 200 IU
Female 200 IU

51-70 years
Male 400 IU
Female 400 IU

71+ years
Male 600 IU
Female 600 IU


A reconsideration is apparently being planned in near-future that will (hopefully) incorporate the newest clinical data on vitamin D.

My question: Who cares what the FNB decides? Let me explain.

I monitor blood levels of 25-hydroxy vitamin D to assess the 1) starting level of vitamin D without supplementation, and 2) levels while on supplementation, preferably every 6 months (during sunny weather, during cold weather). I have done for the past 3 years in over 1000 people.

The requirement for vitamin D dose in adults, in my experience, ranges from as low as 1000 units per day to as high as 20,000 units per day, rarely more. The vast majority of women require 5000 units per day, males 6000 units per day to maintain a blood level in the desirable range. (I aim for 60-70 ng/ml.) A graph of the distribution of vitamin D needs in my area (Milwaukee, Wisconsin) is a bell curve, a curve more heavily weighted towards the upper vitamin D dose range.

Need for vitamin D to achieve the same blood level is influenced by age, sex, body size, race, presence or absence of a gallbladder, as well as other factors. But needs vary, even among similar people. For instance, a 50-year old woman weighing 140 lbs might need 4000 units per day to achieve a blood level of 25-hydroxy vitamin D of 65 ng/ml. Another 50-year old woman weighing 140 lbs might need 8000 units to achieve the same level, and 4000 units might increase her level to only 38 ng/ml. Two similar women, very different vitamin D needs. The differences can be striking.

Being a hormone--not a vitamin, as it was incorrectly labeled--vitamin D needs to be tightly regulated. We should have neither too little nor too much. I would liken it to thyroid hormones, which need to be tightly regulated for ideal health.

Now the FNB, in light of new data, wants to set new AI's, or even RDA's, for vitamin D for the U.S. This is an impossible--impossible--task. There is no way a broad policy can be crafted that serves everyone. It is impossible to state that all men or women, categorized by age, require X units vitamin D. This is pure folly and it is misleading.

The only rational answer for the FNB to provide is to declare that:

It is not possible to establish the precise need for vitamin D in a specific individual because of the multiplicity of factors, only some of which are known, that determine vitamin D needs. Individual need can only be determined by assessing the blood level of 25-hydroxy vitamin D prior to initiation of replacement and periodically following replacement to assess the adequacy of replacement dose. Continuing reassessment is recommended (e.g., every 6-12 months), as needs change with weight, lifestyle, and age.

Sure, it adds around $100-150 per year per person for lab testing to assess vitamin D levels. But the health gains made--reduced fractures, reduced incidence of diabetes, reduced colon, breast, and prostate cancer, less depression, reduced heart attack and heart procedures--will more than compensate.

Bargains for Armour Thyroid

We use Armour thyroid almost exclusively. I take it myself.

I am thoroughly convinced that, for at least 70% of people requiring thyroid replacement, the added T3 component makes a world of difference compared to isolated T4: More energy, greater alertness, better mental clarity, better weight loss, larger effects on lipoprotein(a).

However, there are substantial price disparities in different pharmacies.

For instance, in Milwaukee, a one month supply of 1 grain (60 mg) tablets costs:

Walgreen's: $36.00

Walmart: $9.54


That's a considerable price difference of nearly 400%. It therefore always pays to do a little bit of shopping.

Heart scan mis-information on WebMD

If you want information on how prescription drugs fit into your life, then go to WebMD.

But, if you are looking for information that cuts through the bullcrap, is untainted by the heavy-handed tactics of the drug industry, or doesn't support the "a heart catheterization for everyone" mentality, then don't go there.

A Heart Scan Blog reader turned up this gem on the WebMD site:

Should I have a coronary calcium scan to check for heart disease?

In their report, they list some reasons why a heart scan should not be obtained:

Most of the time, a physical exam and other tests can give your doctor enough information about your risk for heart disease.

You've got to be kidding me. What tests are they talking about?

EKG? An EKG is a crude test that tells us virtually nothing about the coronary arteries or risk for heart attack. It is helpful for heart rhythm disorders and other abnormalities, but virtually useless for coronary disease unless a heart attack is underway or has already occurred.

Cholesterol? What level of cholesterol tells you whether you have heart disease? Tim Russert, for instance, had the same cholesterol values 5 years before his death as on the day of his death. How would cholesterol have told his doctor that heart disease was present? Does an LDL cholesterol of 180 mg/dl tell you that someone has heart disease, while a value of 130 mg/dl does not?

Stress test? You mean like the normal stress test Bill Clinton had 3 months before his near-fatal collapse? Stress tests are a gauge of coronary flow, not of coronary atherosclerosis. Huge amounts of coronary plaque can be present while a stress test--flow--remains normal.

No, a physical exam does not uncover hidden heart disease. The annual physical is, in fact, a miserable failure for detection of hidden heart disease.


You already know that your risk for heart disease is low or high. The test works best in people who are at medium risk but have no symptoms.

This bit of fiction comes from a compromise statement in the American College of Cardiology and American Heart Association "consensus" document detailing the role of heart scans in heart disease detection. Because conventional thinkers don't like the idea of very early detection in seemingly "low risk" people, nor do they like the idea of diabetics and smokers getting a heart scan because it's "obvious" that they are already at high risk, the middle ground was taken: Scan only people at "intermediate risk."

What the heck is "intermediate risk"? Are you intermediate risk?

In real life, using standard criteria (e.g., Framingham scoring) to decide who is low-, intermediate-, or high-risk fails to identify over 1/3 of people with heart disease, while subjecting many without heart disease (plaque) to needless treatment (meaning statins, since that's the only real preventive treatment on most doc's armamentarium).

Another fact: Heart scans are quantitative, not just normal or abnormal. Your heart scan score could be 5, it could be 150, it could be 500, or 5000---it makes a world of difference. The risk of someone with a score of 5000 is at very different risk than someone with a score of 5. It also provides much greater precision in determining a specific individual's risk.


The test could give a high score even if your arteries aren't blocked. This might lead to extra tests that you don't need.

This is true--if you doctor has no idea what he's doing.

This is like saying that you should never take your car to the repair shop because all mechanics are crooks. If you have an unscrupulous cardiologist who tells you that your heart scan score of 25 means you are a "walking time bomb" and heart catheterization is necessary to determine whether you "need" a stent . . . well, this is no different than the shady mechanic who advises you that your car's engine needs to be rebuilt for $3000, when all you really needed was a few new spark plugs.

Coronary plaque is coronary plaque, and all coronary plaque has potential for rupture (heart attack)--even if it doesn't block flow. This is true at a score of 10, or 100, or 1000--all plaque is potentially rupture-prone, though the more plaque you have, the greater the likelihood.


Not all blocked arteries have calcium. So you could get a low calcium score and still be at risk.

They're missing the point: ANY calcium score carries risk, so a low score should not be interpreted as having no risk. But, just because a procedure like stenting or bypass surgery is not necessary to restore flow, it does not mean that risk for plaque rupture is not present--it is.

Any heart scan score should be taken seriously, meaning sufficient reason to engage in a program of heart disease prevention.

Although not perfect, coronary calcium scoring remains the easiest, most accessible, and least expensive means for identifying and quantifying coronary atherosclerosis--whether or not WebMD and drug industry money endorse them.

Heart disease prevention for the helpless, ignorant, or non-compliant

The media outlets are gushing with the "research"/marketing spinoff of the JUPITER trial, an analysis conducted by Dr. Erica Spatz of Yale University, that suggests that statin use should be expanded to many millions more Americans.

USA Today: Study: 11M more should get statins

MedPage: JUPITER Findings Could Boost Statin Use by 20%

Health Day: Millions More Americans Might Be Placed on Statins

WebMD: More May Benefit From Cholesterol Drugs: Study Shows More Would Qualify for Statin Treatment if Levels of C-Reactive Protein Are Considered


You may recall that the JUPITER trial (discussed previously in a Heart Scan Blog post) studied the cardiovascular event risk in people with "normal" LDL cholesterols (calculated, of course, not measured) of 130 mg/dl or less, along with increased c-reactive protein, a crude inflammatory measure, of 2.0 mg/dl or greater. A 54% (relative) reduction in cardiovascular events occured in the group taking Crestor 20 mg per day.

What I see is a confluence of events that have brought us to the "statin drugs are necessary for everybody" mentality:

--The low-fat diet advice of the last 40 years has increased non-fat or low-fat foods that increase LDL, since removing fat from the diet provokes small LDL particle production and increases the inflammatory measure, c-reactive protein (CRP).

--The proliferation of "healthy whole grains" in the diet have also caused an enormous boom in small LDL particles, which is interpreted to the uninformed as "high cholesterol." It has also provoked CRP substantially.

--The advice to reduce salt intake has brought a broad re-emergence of iodine deficiency. When thyroid hormone production flags due to lack of iodine, LDL cholesterol (both large and small) increase.

--Our lives, which are increasingly conducted indoors, have worsened the already substantial vitamin D deficiency. While deficiency of vitamin D primarily reduces HDL cholesterol and increases triglycerides, it can also cause an increase in small LDL and a large increase in CRP.


In other words, a collection of events have converged to provide the appearance of high LDL cholesterol and high CRP. This creates the appearance of a "need" for statin drugs. The JUPITER trial now exploits both the LDL-reducing and CRP-decreasing effects of statins.

I view the foisting of Crestor via the JUPITER argument on the public as taking full advantage of the helpless situation many Americans find themselves in: Reduce fat intake, eat more healthy whole grains and . . . cholesterol and CRP skyrocket! "You need Crestor! See, I told you it was genetic," says the doctor after attending the nice AstraZeneca-sponsored drug dinner.

The notion of using a drug like Crestor to suppress inflammatory patterns is absurd. There are far better, easier, cheaper ways to achieve this goal, along with dramatic reduction in cardiovascular risk. But, to the ignorant, the helpless, or non-compliant with real change in diet and lifestyle, then Crestor does serve a purpose.

I can only hope that the excessive pushing of statin drugs on the public will sooner or later trigger a revolt.

Dangerous mis-information on vitamin D


Please be aware of the ignorant propagating information they have no business talking about.

This is one such example, a newsletter from pop exercise guru, Denise Austin.

Although I'm sure she means well, I have a problem with people who have little to no experience acting as experts, often simply repeating something they heard or read somewhere else. This has become particular problem with the internet, in which bad information can get repeated thousands of times, gaining a veil of "truth" through its repetition. I don't mean to pick specifically on Ms. Austin, since she joins a growing rank of pseudo-experts on vitamin D and other topics, but she provides a good example of how far wrong mainstream information can be.


Simple Steps
Do Your D!


Calcium often gets all the glory when it comes to bone health. But calcium wouldn't benefit your bones much without its partner, vitamin D!

Why? Vitamin D helps your body absorb calcium and keeps your bones strong; without enough vitamin D, the bones become weak and brittle, a condition called rickets in children, and osteomalacia in adults. Adults from 19 to 50 need 200 IU (international units) per day, while those from 51 to 70 need 400 IU daily. Those over 70 need 600 IU per day.

Unfortunately, not too many foods contain vitamin D naturally. (Tuna and sardines canned in oil are exceptions.) The good news is that many foods are now regularly fortified with vitamin D, including milk, some yogurts, margarines, and cereals. You can check the Nutrition Facts panel on packages and containers to see which products contain vitamin D. It should be listed after vitamins A and C, along with the percentage of the Daily Value that a serving of the food contains. The Daily Value (a standardized amount) for vitamin D is 400 IU, so if your milk has 25 percent of the Daily Value, it provides 100 IU per serving.

Your skin can also make vitamin D using sunlight — you need about a half hour of exposure to the midday sun twice a week to make enough. However, because of the increasing incidence of skin cancer in recent years, many experts are wary about recommending sun exposure.

So take a closer look at milk, yogurt, cereal, and margarine selections when you're doing your weekly shopping, and stock up on brands that are fortified with vitamin D. Challenge yourself to consume one source of vitamin D at least three days in the coming week! If you cannot eat or do not like any foods that contain vitamin D or are fortified with it, talk with your health care provider ASAP about taking a supplement. Your bones will thank you for it!


Let me list the mistakes in this piece:

Adults from 19 to 50 need 200 IU (international units) per day, while those from 51 to 70 need 400 IU daily. Those over 70 need 600 IU per day.

This is the same non-information that was the advice originally offered by the Food and Nutrition Board based on a best guesstimate due to lack of data. It is clear from newer data that doses required for full restoration of vitamin D are in the thousands of units. (My personal dose for full restoration of vitamin judged by serum levels of 25-hydroxy vitamin D is 8000 units per day.)

The information coming from the Food and Nutrition Board is about as good as the information coming from the USDA (you know, that "government" agency meant to represent the interests of ConAgra, Cargill, and Big Farming) and the American Heart Association (that represents consensus opinion from data 20 years out of date and now arm-in-arm with Big Food like General Mills, Kraft, and Nabisco). These agencies and the advice they offer has, over the past few years, become increasingly irrelevant and outdated. It is the Information Age, in which ulterior motives are becoming more readily exposed, yet they still operate by the rules of the Industrial Age and deliver a message that serves their own purposes.

Ms. Austin fell for it.


The good news is that many foods are now regularly fortified with vitamin D, including milk, some yogurts, margarines, and cereals.

First of all, what is a "diet expert" doing advocating industrial foods? Cereals, in particular, are among the worst foods on the supermarket shelves, whether or not they are fortified. Candy bars can be fortified, too; that doesn't make them any better for you.

The vitamin D added to these foods is, more often than not, the ergocalcferol, or D2, form that is woefully ineffective. And the dose added is trivial, usually in the 100-200 unit range per serving. The same goes for the milk, an inadequate source that we don't even factor into total intakes because of the low quantity.


Your skin can also make vitamin D using sunlight — you need about a half hour of exposure to the midday sun twice a week.


Nope. This might be true for a young person below age 30 in a southern environment. It is NOT true for the majority of people in northern climates and anyone over age 30 or 40, since we lose most of the capacity to activate vitamin D in the skin as we age. A deep, dark Florida tan does not necessarily mean that vitamin D has been activated. See A tan does not equal vitamin D. Here in Wisconsin, where, despite this darn cold winter, does enjoy wonderfully warm and beautiful summers, the average vitamin D dose need ranges from 4000-8000 units per day in summer, slightly more in winter.

By the way, it is not calcium that is instrumental to bone health. It is vitamin D. Calcium is the passive bricks and mortar of bones, while vitamin D is the bricklayer, the determinant of calcium's fate, the master control of bone health. Calcium supplementation becomes almost immaterial when vitamin D is restored.

I praise Ms. Austin for her hard work, trying to help fat Americans lose weight. But please ignore her advice on vitamin D, along with the numbing repetition of this mis-information that will likely propagate from other exercise gurus, dietitians, and pseudoexperts.

A Tale of Two LDL's

Kurt, a 50-year old businessman with a heart scan score of 323, had a :

--Conventional (calculated) LDL of 128 mg/dl
--Real measured LDL 241 mg/dl.


Laurie, a 53-year old woman who underwent a coronary bypass operation last year (before I met her), had a:

--Conventional LDL of 142 mg/dl
--Real measured LDL was 85 mg/dl.


(By "real, measured" LDL, I'm referring to LDL particle number in units of nmol/L obtained through NMR lipoprotein testing and dividing by 10, or just dropping the last digit to convert the value to mg/dl. This technique was arrived at by comparing the population distributions of these two parameters, LDL particle number and calculated LDL. This is the gold standard in my view. Similar numbers can be obtained by measuring apoprotein B, direct LDL, or calculated non-HDL, with diminishing reliability from first to last.)

In other words, Kurt's conventional LDL underestimated real LDL by 88%. Laurie's conventional LDL overestimated real LDL by 40%.

Interestingly, Laurie's doctor had insisted she take Lipitor for a high LDL cholesterol. Her real LDL was, in fact, low to begin with and benefits of a statin drug would be little to none. (Remember, in our Track Your Plaque approach, multiple other treatments are included, such as omega-3 fatty acids from fish oil, vitamin D normalization, and wheat elimination, strategies that yield benefits that others expect to obtain with statins.) Laurie's real cause of her heart disease proved to have nothing to do with LDL cholesterol, but involved lipoprotein(a) and thyroid issues.

Kurt proved to have a severe preponderance of small LDL particles--the worst kind of LDL, while Laurie had none--a benign pattern.

Then how can anyone make sense of the conventional, calculated LDL cholesterol that is generally (95% of the time) provided? If accuracy can stretch to plus or minus 80% . . . you can't. Conventional LDL is a miserably inaccurate number. The problem is that obtaining a superior number requires a step or two more testing and insight, something most busy primary care doc's simply don't have in the midst of a day filled with arthritis, bronchitis, diarrhea, belly aches, and seborrhea.

Yet conventional--I call it "fictitious"--LDL serves as the basis for this $27 billion (annual revenues) industry selling statin drugs.

This is meant to be neither an argument in favor of nor against statin drugs. However, it is plain as day that any study designed to reduce LDL cholesterol will be hopelessly clouded by calculated LDL imprecision. A calculated LDL of, say, 143 mg/dl might really be 187 mg/dl, or it might be 74 mg/dl--you can't tell by looking just at LDL. Yet billions of dollars of research and billions of dollars of healthcare costs are based on the treatment of this number.

This reminds me of the mark-to-market accounting magic that helped topple Wall Street.

I don't think that the statin world is poised for such a huge downfall. But I do see this as a source of enormous dilution of the effects of statin drugs. People who barely stand to benefit get the drugs, while others who might truly benefit are treated inadequately. It provides fuel to the growing idea that reducing LDL cholesterol fails to truly provide benefit.

I am no lover of statin drugs nor drugs in general. But I am a fan of knowing the truth. Despite my bashing of the drug industry (and make no mistake: the drug industry is a cutthroat, profit-seeking, do-anything-to-increase-sales industry), I do believe that there is a role for statin drugs (though far smaller than $27 billion per year). But the usual method of selecting people for treatment is pure fiction. The ATP-III cholesterol treatment guidelines? An anemic attempt to apply structure to meaningless values.

You and I do not need to subscribe to this sort of non-quantitative nonsense.

Copyright © 2026 Cureality.com